March 31, 2026
USDCAD open: 1.3937, overnight range 1.3917-1.3942, close 1.3925
USDCAD drifted higher overnight, despite Trump reportedly looking to end the Iran war without opening the Strait of Hormuz. The US dollar index has retreated in NY trading, falling to 100.17 from 100.55, but the Canadian dollar has barely budged.
The Globe and Mail reported that Prime Minister Mark Carney is reportedly planning to prorogue parliament if they win all three by-elections on April 13, which would give them a 1-seat majority. Proroguing parliament allows them to restructure committees and ensure that their legislation gets passed.
WTI oil prices traded in a 100.88-106.82 range with the low seen in Asia. Prices have since rebounded to 104.53. Prices are churning due to conflicting headlines about the US and Iran war.
The Canadian economy grew 0.1% m/m in January, a tick higher than what StatsCanada had predicted last month. It is expected to grow by 0.2% m/m in February. The results are hardly stellar and underscore how vulnerable the domestic economy is to a global slowdown.
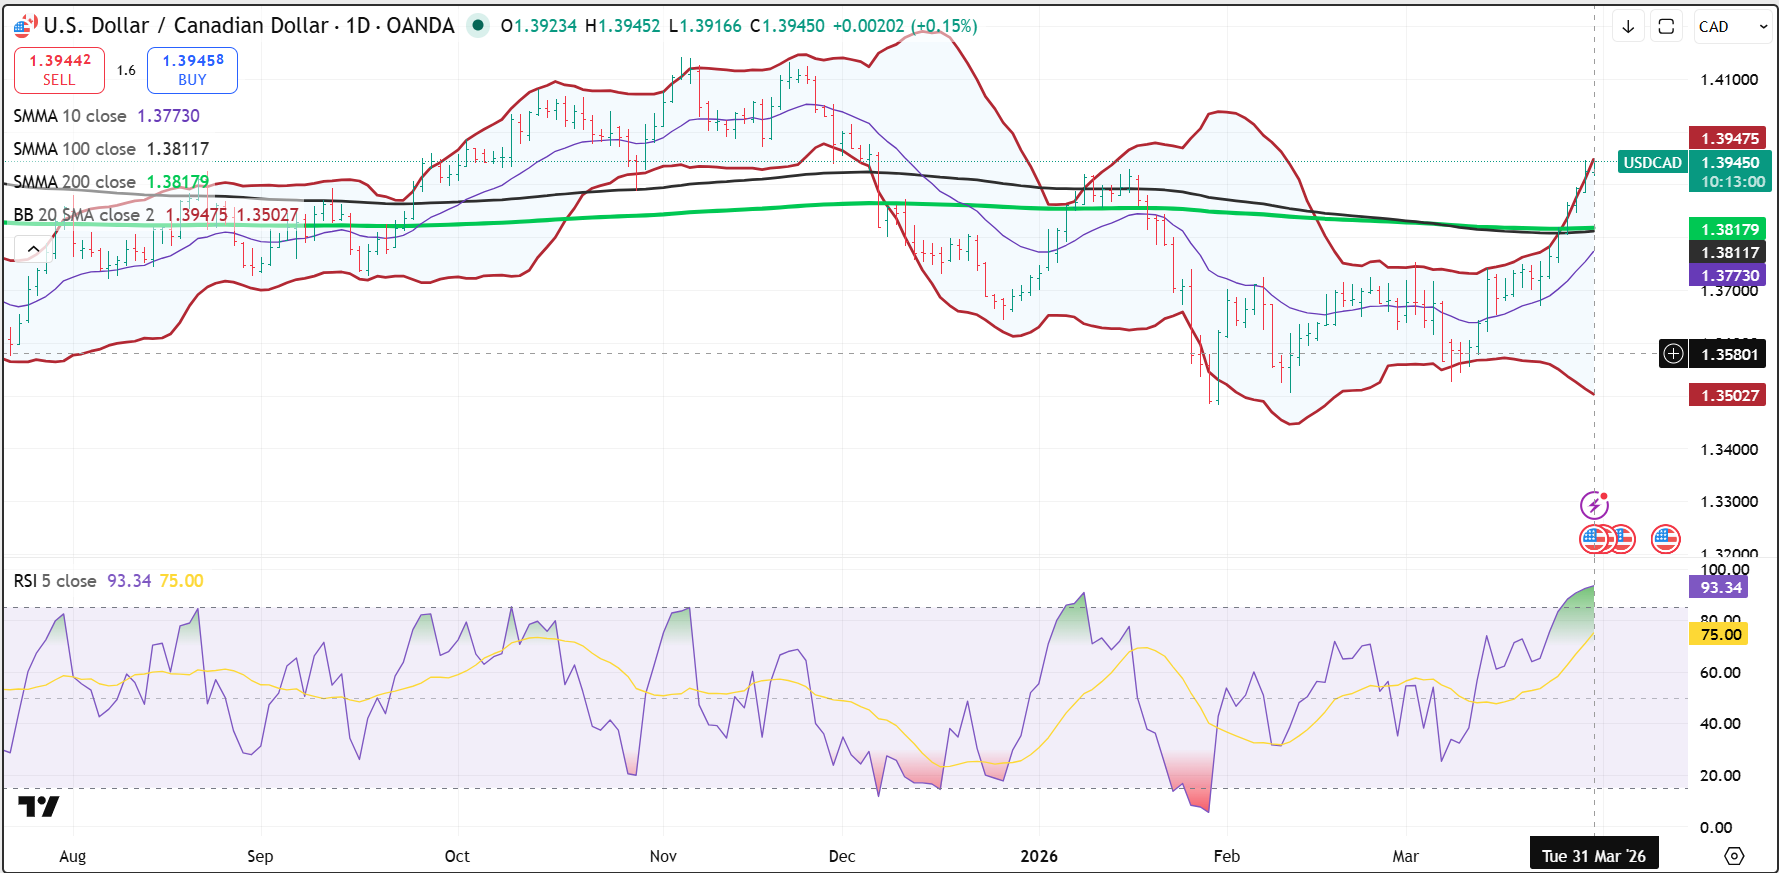
USDCAD Technical Outlook
The intraday USDCAD technicals are bullish above 1.3890 and looking for a break above the 1.3950–1.3965 resistance area (upper Bollinger band on the 4-hour chart) to extend gains toward 1.4000. A break below 1.3890 targets 1.3850 and then 1.3815.
WARNING: The momentum indicators are at extreme overbought levels on the 4-hour and daily charts, with RSI near 90 and prices riding the upper Bollinger band. This rally is stretched and overdue for a corrective sell-off.
The medium-term USDCAD technicals are bullish above 1.3812, where the 100-day and 200-day moving averages converge, reinforcing that area as key support. The break above the 1.3820–1.3850 area confirms upside momentum, but the daily RSI near 93 and sharply expanded Bollinger Bands highlight an overextended market. A sustained move above 1.3965 opens the door to 1.4000 and potentially 1.4050, while failure to hold above 1.3820 risks a return to the broader 1.3550–1.3950 range.
For today, USDCAD support is at 1.3890 and 1.3850. Resistance is at 1.3970 and 1.4000.
Todays range 1.3860–1.3960.
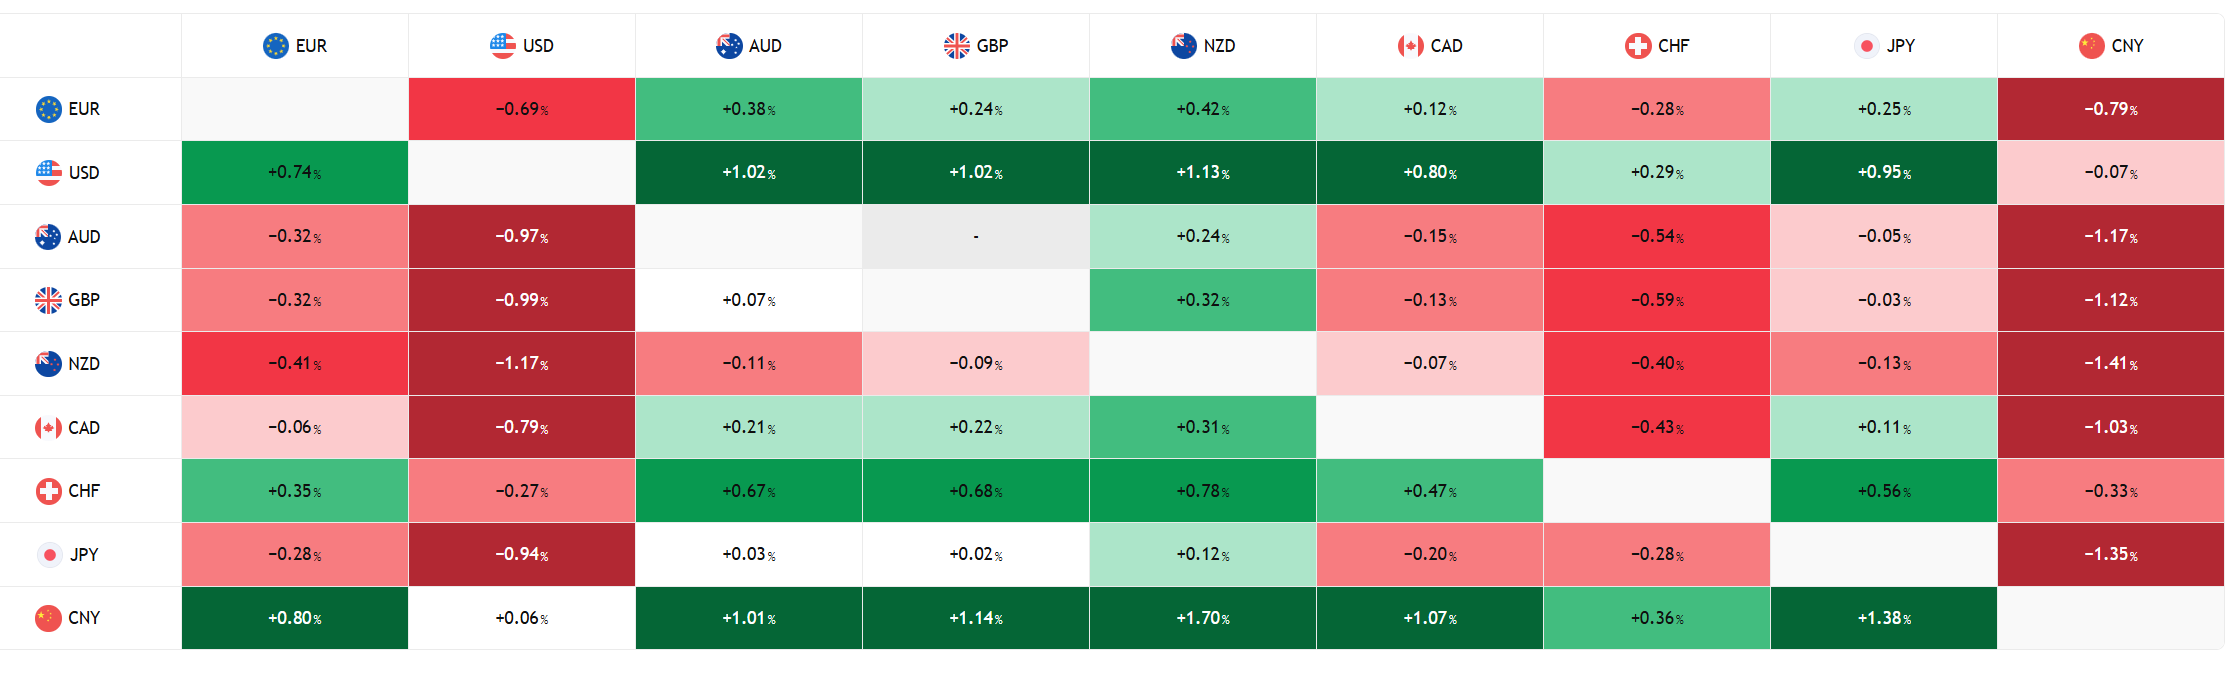
FX Heat Map (6:00 am) one week
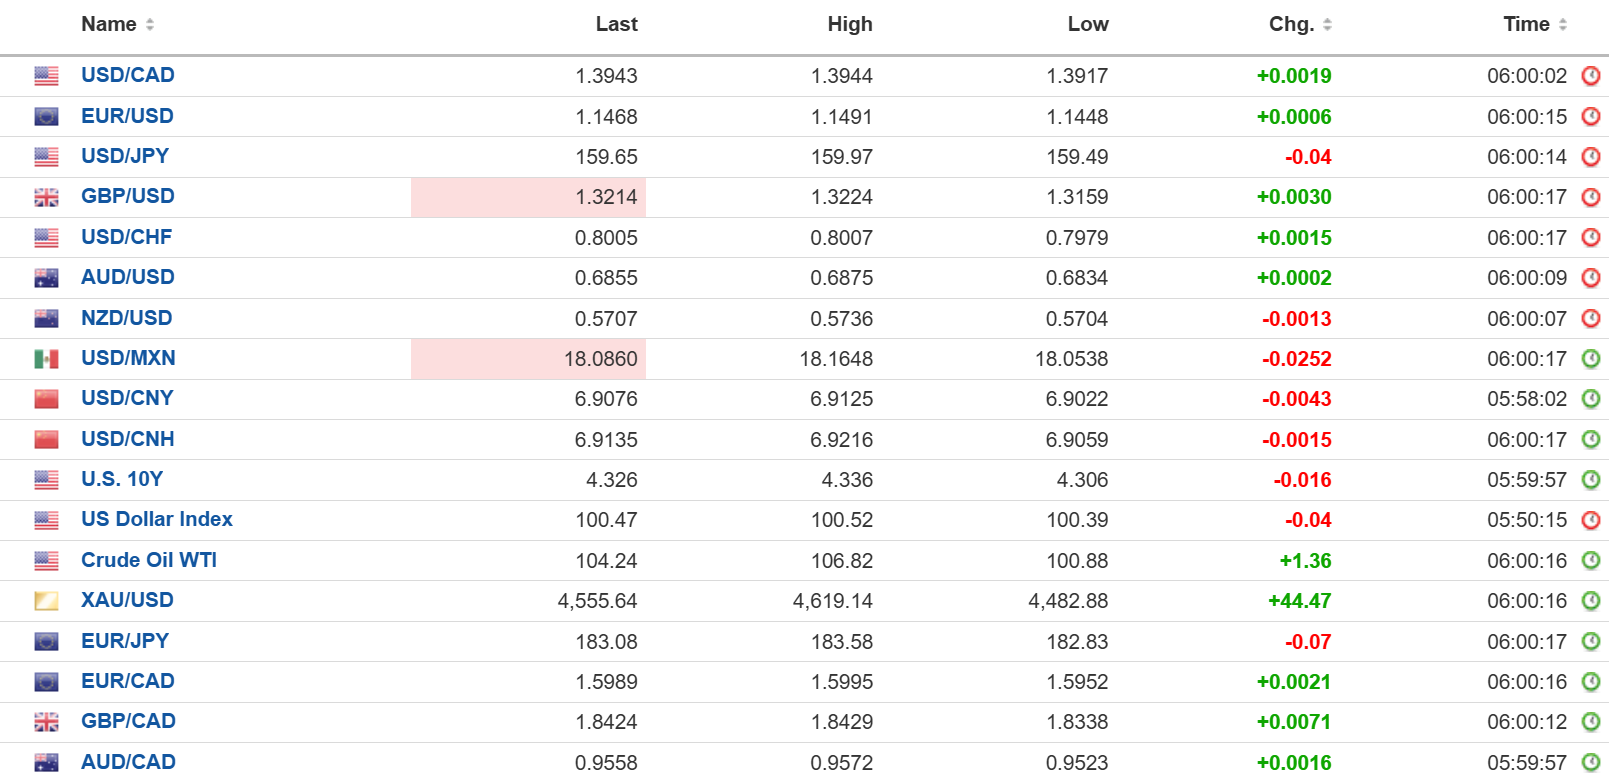
FX open high low 6:00 am
Looking for an Exit
The Wall Street Journal reported that Trump was willing to end the war in Iran without opening the Strait of Hormuz. The news gave European equities a bit of a boost, weighed on Treasury yields, and helped to lift gold prices. WTI dropped from 106.82 to 100.88 on the news.
If Trump is planning to end the war early, then why did he order a massive build-up of troops into the area? FX traders are right to be sceptical.
Powell Preaches Patience
Fed Chair Jerome Powell told students at Harvard that he thought keeping interest rates steady and ignoring the energy shock was the right monetary policy, for now. He acknowledged price pressures from the energy shock but noted that energy shocks also produce slowing growth and a weaker employment picture.
The employment picture comes into focus today with the release of the JOLTS job openings report, which is expected to show job openings fell to 6.87m from 6.946m. The Fed watch odds are 97% for an unchanged result at the April 29 FOMC meeting.
Chicago PMI and Consumer confidence are also on the agenda.
Taking Stock
Asian equity indices closed in the red. Japan’s Topix dropped 1.26% to end the month with a loss of 10.35%. The Hong Kong Hang Seng rose 0.15%, but lost 6.7% in March, while Australia’s ASX rose 0.25% but still lost 6.93% in March.
As of 5:30 AM PT, European bourses are higher, led by the German DAX which has gained 1.03%, followed by the FTSE 100 which is up 0.96%, and the French CAC which has gained 0.78%. S&P 500 futures are up 1.22%, the 10-year Treasury yield is 4.311%, the DXY is 100.18, and Gold (XAUUSD) is 4580.75.
EURUSD
EURUSD traded firmer in a 1.1448-1.1510 range, which is a modestly positive end to a crummy month. The euro lost 2.74% MTD vs the greenback in March. The single currency was underpinned today by the WSJ story about an early end to the Iran war. The short-term technical picture is bearish. Headline HICP inflation was a tad softer than expected at 2.5% y/y (forecast 2.7%) as was core HICP, which rose 2.5% (forecast 2.7% y/y).
GBPUSD
GBPUSD rose from 1.3159 to 1.3249 due to improved risk sentiment from fresh hopes of an early end to Trump’s war on Iran and from better-than-expected UK data. Despite the rally, GBPUSD is down 2.01% for the month. UK house prices rose 0.9% m/m in March compared to 0.3% in February. The Office of National Statistics reported UK GDP rose 0.1% between October and December and 1.4% y/y.
USDJPY
USDJPY was choppy in a 159.35-159.97 range. Tokyo inflation and Japanese unemployment data failed to spur any interest. Prices were on the defensive because of lower oil prices and softer Treasury yields.
AUDUSD
AUDUSD drifted in a 0.6834-0.6890 range, with prices supported by improved risk sentiment and hawkish RBA minutes from the March 17 meeting. Policymakers agreed on the need for further tightening, noting that WTI at $100/b would lift Australian inflation to around 5.0%. The Australian dollar lost 3.46% vs the US dollar in March.
USDMXN
USDMXN traded sideways in an 18.0005-18.1648 band. Broad-based demand for US dollars, risk aversion from Trump’s war on Iran, and the rise in US Treasury yields fueled a 5.24% increase in USDMXN in March.
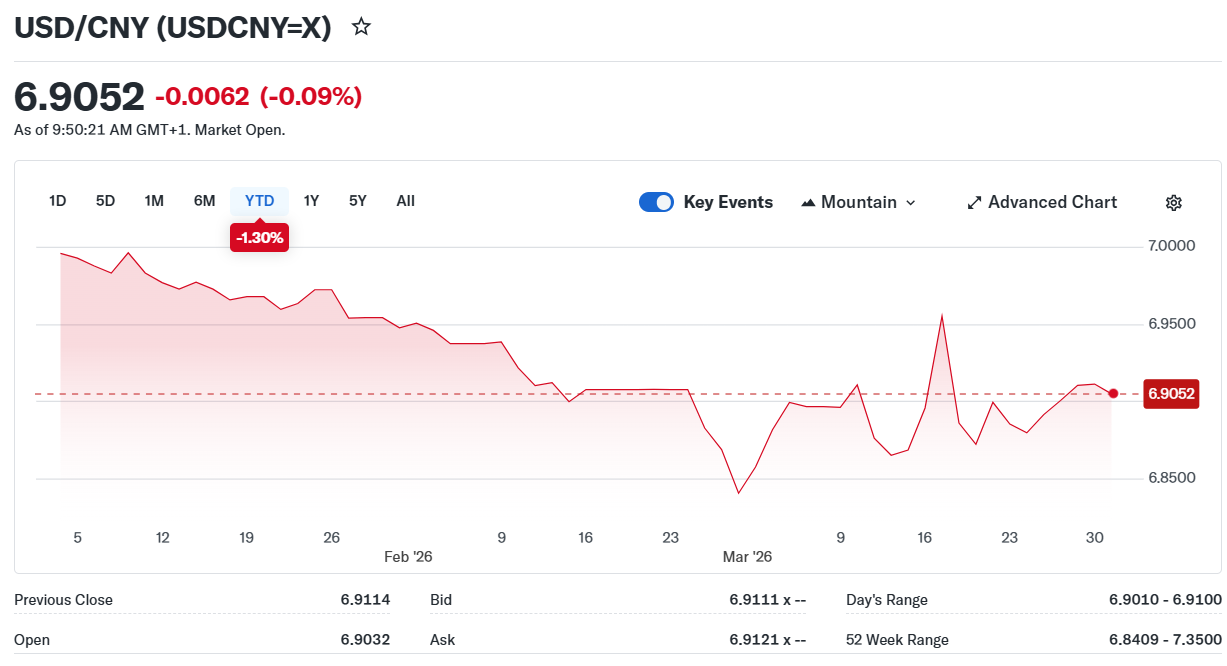
China
USDCNY Fix: 6.9194 vs exp. 6.9209 (Prev. 6.9223)
Shanghai Shenzhen CSI 300 fell 0.93% to 4,450.05
NBS Manufacturing PMI rises to 50.4 from 49 in February. Non-Manufacturing PMI rises to 50.1 from 49.5.
Sources: Investing.com, Bloomberg, Reuters, Yahoo Finance, US Census Bureau, Trading Economics Tradingview