
By Michael O’Neill
Wikipedia says the Dog Days of Summer are the days between July 12 and August 20. It is usually the hottest stretch of the summer, often associated with long, lazy days, drought, and sudden thunderstorms. The term arises from when the sun and Sirius (“the Dog Star”) are in the same region of the sky. Coincidently, the “Barking Mad Dog Days of Summer” occur during the same period but refer to President Trump and his Twitter account.
This season has been exceptional. President Trump tweeted 246 times (excluding re-tweets) from July 12 to August 14. Financial markets were violently whip-sawed after some tweets as evidenced by the chart below. It shows the US dollar index (DXY) and S&P 500 index activity during that time.
USDX and S&P500 during Barking Mad Dog Days of Summer
Source: Yahoo Finance.
Fed Chair Jerome Powell has been a favourite target. The President complained about the Fed’s “antiquated policy on rates and tightening” when the Dog Days first arrived, and he continued with that theme on August 14. He tweeted comments from a FOX TV business analyst saying “Fed Chair Jay Powell made TWO enormous mistakes. 1. When he said, “mid cycle adjustment.” 2. We’re data dependent. “He did not do the right thing.” I agree (to put it mildly)!”
The market reaction to Trump’s rants against Mr Powell have been muted of late. Nevertheless, the incessant haranguing of the Fed and its policy erodes confidence in the Fed’s ability to remain independent.
President Trump’s China tweets sparked the most volatility during the Barking Mad Dog Days of Summer. He started out accusing China of devaluing their currency and a few days later was gloating about their weak GDP growth data. Trump took shots at Apple and Google for their business relationship with the country. Then he put the match to the gasoline when the US trade delegation returned from Beijing. He tweeted “Our representatives have just returned from China where they had constructive talks having to do with a future Trade Deal.” Then added, “the US will start, on September 1st, putting a small additional Tariff of 10% on the remaining 300 Billion Dollars of goods and products coming from China into our Country.”
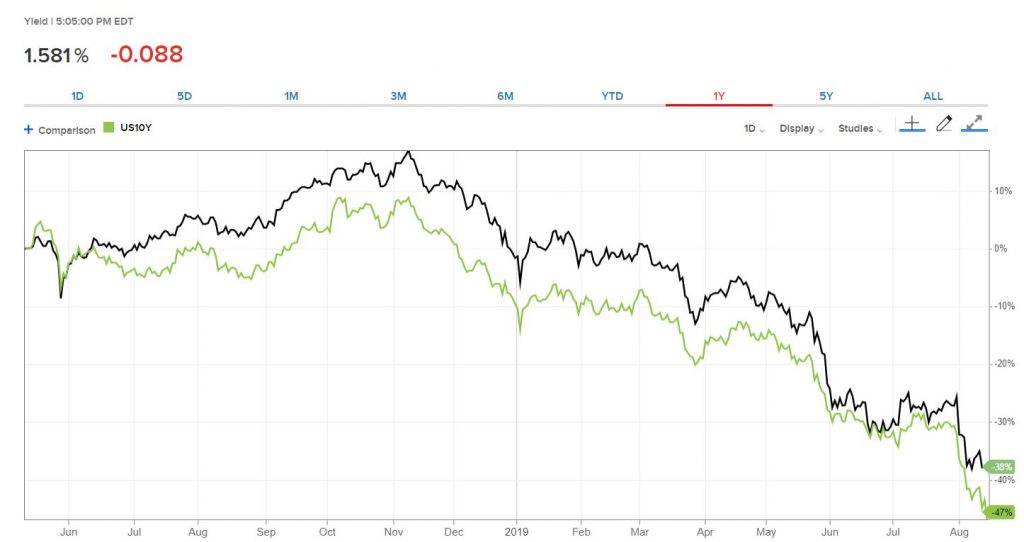
If his goal was to roil global financial markets, he succeeded exceedingly well. Global equity and oil markets plunged as did the yield on 10-year US Treasuries. The sequel was even better. On August 4, President Trump accused China of currency manipulation, and Steven Mnuchin’s Treasury Department followed up by officially designating the country as a “currency manipulator.” Financial markets were not amused. FX traders stampeded into safe-haven currencies, stocks plunged, and bond prices soared. Making America Great Again is exacting a toll on traders.
Mr Trump often tweets about the “tens of billions of dollars” pouring into the US from the tariffs. More accurately, he should be tweeting about the higher sales taxes forced upon American consumers. For example, Apple may want to continue earning a reported 64% margin on the sale of an iPhone X. If it costs them 10% more to import the phones from China, the consumer will pay.
American retailers were up in arms about the latest round of tariffs. CNBC reported tariffs added $70 million to Caterpillars Q2 production costs. Walmart and Macey’s warned of increased prices for shoppers. The New York Fed wrote in a paper on May 23 that Trump’s tariffs could cost American consumers $106.074 billion or $831.00 per household every year. Making America Great Again is expensive for Americans.
Chart: Impact of tariffs
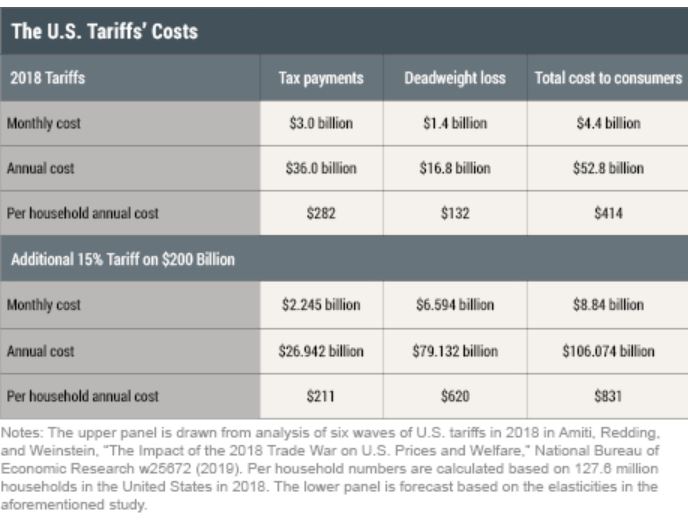
Source: Federal Reserve Bank of New York
President Trump said his IQ. was “one of the highest.” That may explain how he figured out that the “tens of billions” of tariff dollars may not be benefiting the average consumer. (voter) On August 13, he announced a delay in the September 1 tariffs, until December 15 but only for some consumer products. The Office of the Trade Representative listed 21 pages detailing about 550 goods impacted by the decision. One category exempted was 0101.30.00, Live asses. Seriously, are live asses (if they aren’t politicians) really undermining the US economy?
Once again, Financial markets were whipsawed. Safe-haven trades were abandoned, and oil prices soared. China said they planned to attend trade talks in September and traders decided the latest drama was merely more “Art of the Deal.”
The euphoria barely lasted 24 hours. Sentiment became inverted. Actually, sentiment turned negative. The US yield curve inverted. That is what happens when longer-term yields fall below short term yields. On August 14, the yield on the US 10 year bond dipped below that of the US 2 year, and in the past, that kind of move signalled a recession. The Federal Reserve Bank of San Francisco wrote last year that “Every U.S. recession in the past 60 years was preceded by a negative term spread, that is, an inverted yield curve. Furthermore, a negative term spread was always followed by an economic slowdown and, except for one time, by a recession.” They prove it with the following chart which shows the “the difference between ten-year and one-year Treasury yields from January 1955 to February 2018, together with shaded areas for officially designated recessions.”
Chart: Yield curve and recession
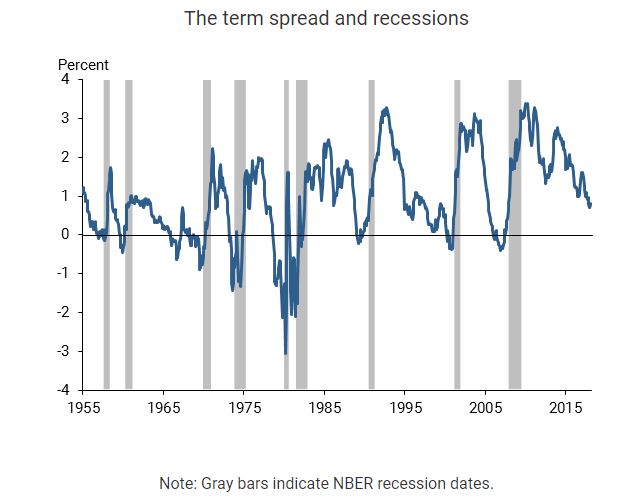
Source Federal Reserve Bank of San Francisco
The yield curve inversion on August 14 drove the Dow Jones Industrial Average to its biggest one-day loss in 10 months. The Japanese yen and Swiss franc rallied as traders scrambled for safe-haven trades while the commodity currency bloc plunged on global growth concerns.
Is Chicken Little right? Is the sky falling? August is a big holiday month with many senior traders booked off for vacations. Many are obligated to take two consecutive weeks off for compliance reasons leaving less experienced people to man the desks. If so, perhaps the recent market volatility is exaggerated. After all, it is the Barking Mad Dog Days of Summer.