By Michael O’Neill, Agility FX Analyst
The Fed delivered what the financial markets expected. The Federal Open Market Committee (FOMC) announced an increase in the target range for the federal funds overnight rate to ½ to ¾ percent.
This was one of the better telegraphed rate increases in recent memory. A legion of Committee members all but confirmed that a rate hike was coming, in a series of speeches and interviews following the October meeting. The CME’s FedWatch tool had the December 14 move probability at 94 percent. It isn’t any wonder that no one was surprised.
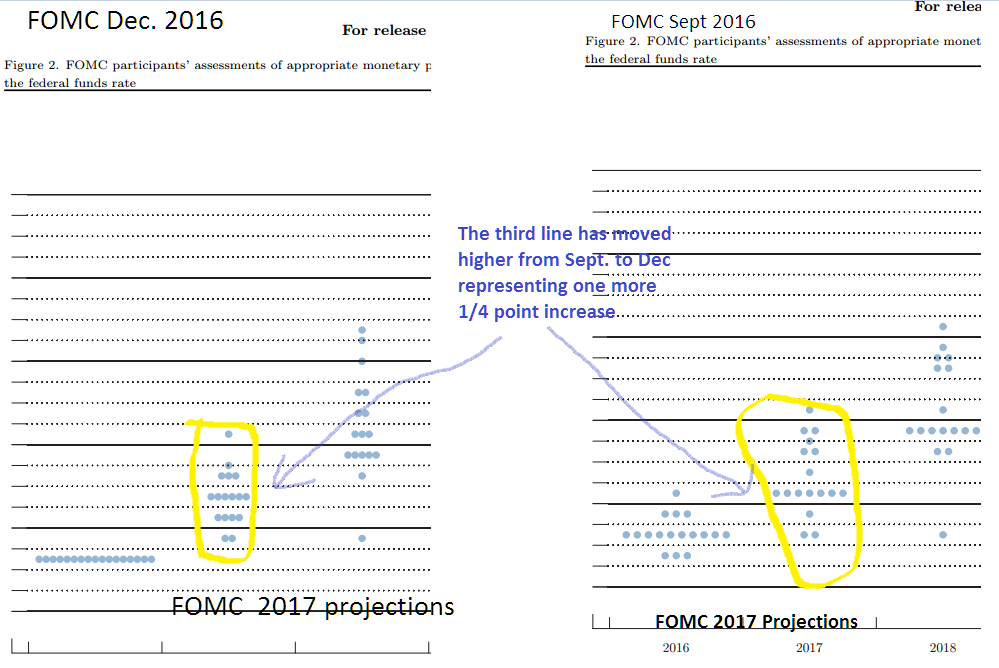
The surprise was in the Summary of Economic projections, specifically, the dot-plot. The seventeen members of the Committee added one more rate increase in 2017 to what they had projected in September. Rates are now forecast to rise to 1.375 percent instead of 1.175%.
And that’s when US dollar bears found themselves without a paddle, sitting in a canoe, adrift in the effluent.
The US dollar soared, the price of gold plummeted, oil prices sprung a leak and US equity indices sank. The only thing missing was an elderly man with a long white beard wearing a sandwich board sign that proclaimed “The End is Near.”
And is it?
Do you remember all the hoopla and fanfare that greeted the Fed’s last rate hike, one year ago? At that time, the dot-plot indicated four rate increases in 2016. Economists dutifully penciled in a 0.25 percent bump each quarter beginning in March. We all know how that worked out.
Federal Reserve Chair Janet Yellen didn’t seem to think that the latest version of the dots meant much. In her press conference, she described the moves as “slight” upgrades by only a few officials.
Chart: Comparison Dec 206 and Sept. 2016 FOMC dot plots
 Source: FRB/IFXA
In a speech at Jackson Hole, Wyoming on August 26, Ms. Yellen explained that the dot-plot is merely representative of a range of likely outcomes for the federal funds rate because “the economy is frequently buffeted by shocks and rarely evolves as predicted.”
The dot-plot is misleading in another way. The graph contains the projections of all 17 seventeen FOMC members, but only 12 have a vote.
Furthermore, Janet Yellen has always said that rate hikes are data dependent. Wednesday’s statement reaffirmed that view- “the actual path of the federal funds rate will depend on the economic outlook as informed by incoming data.“
The Monetary Policy Statement on December 14 expressed concerns about low inflation and soft business fixed investment, the same concerns that were present in September, when rates did not increase.
Nevertheless, FX markets reacted like a 1.375 percent interest rate was a reality rather than wishful thinking.
The US dollar soared against the G10 currencies. EURUSD is now projected to reach par while USDJPY is targeting 125.00, a level not seen since August 2014. That could happen according to the US dollar index.
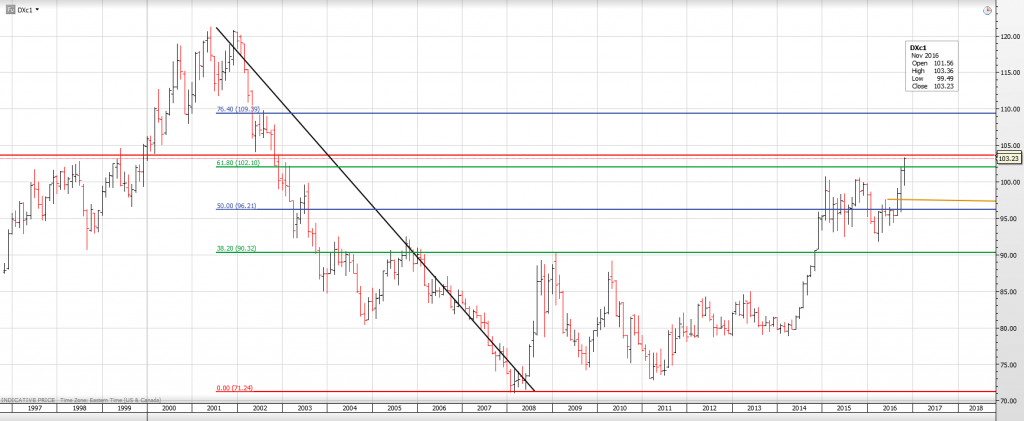
The US dollar index (USDX) is a weighted measure of the greenback against a basket of currencies. The index is comprised of Euro, Japanese yen, British pound, Canadian dollar Swedish krona and the Swiss franc. The Euro comprises 57.6% of the index. The USDX was 91.85 in March and on December 15, it hit 103.25. That level has not been seen since January 2003. Long term Fibonacci retracement indicators suggest that if USDX can stay above 102.10, it could extend gains to 109.40.
Chart USDX Monthly with long term Fibonacci retracement projections
 Source: Saxo Bank
The US dollar is getting additional support due to anticipation of fiscal stimulus from the Donald Trump government. Promised tax cuts and infrastructure spending are expected to boost economic growth, raise inflation and support the projected rate increases.
Those expectations have put the Loonie in the cross hairs. The Bank of Canada is a long way from increasing rates. In fact, a rate cut is not out of the realm of possibility. In the December 7 interest rate statement, the Bank of Canada noted “ a significant amount of economic slack remains in Canada, in contrast to the United States. “
Opec and non-Opec nations have done their part to support the Canadian dollar. Actually, they had their own interests in mind when they opted trim oil production by close to 1.8 million barrels per day. The rally in oil prices has certainly served as a brake on USDCAD gains.
The current US dollar rally may be close to pausing, mostly due to the calendar. The holiday season in large parts of the world officially kicks off around lunch time ton December 16. FX liquidity has already diminished and it won’t get any better until the new year.
The US dollar has made substantial gains in the past month and the prospect of a profit-taking, position trimming sell-off is likely. If that occurs, the thin market conditions could make big moves out of what should have been little moves.
FX traders may be guilty of having short memories, but they are not senile. The dot-plot projection of four rate hikes in 2016 that became just one, is too fresh in their minds. With uber-dove, Janet Yellen at the helm of the Fed, three rate hikes may just be a mirage or not.