March 2, 2026
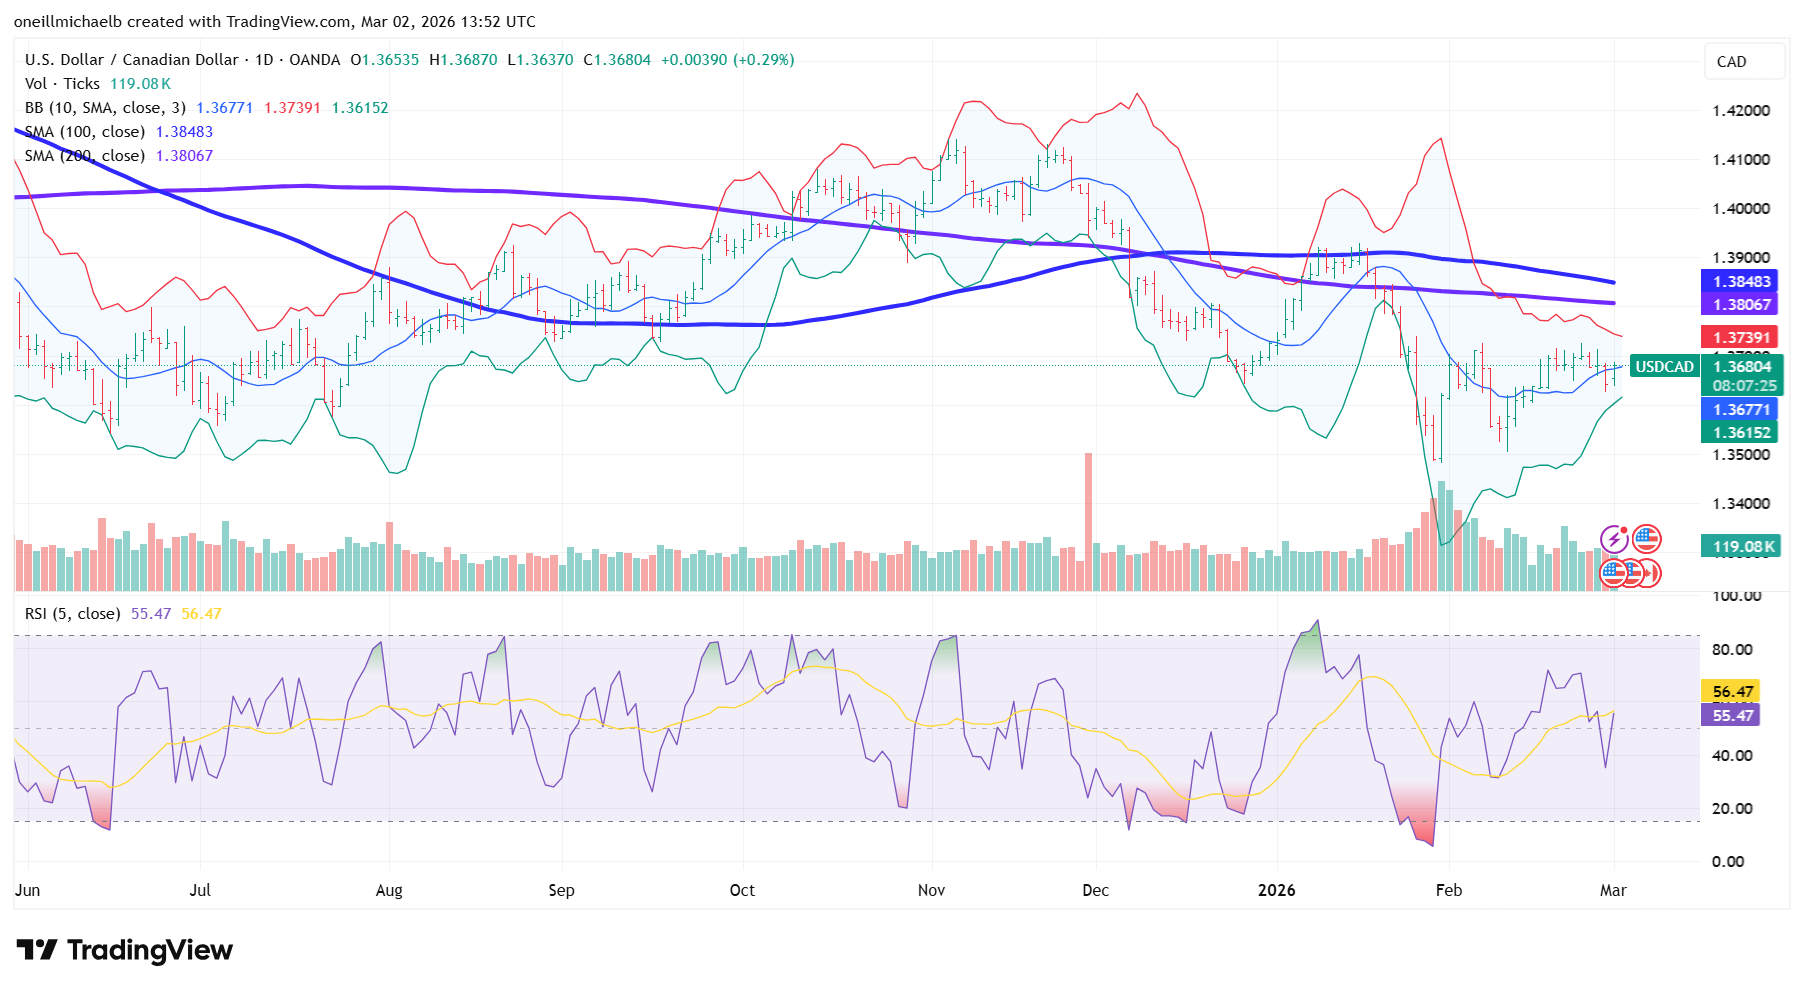
USDCAD open: 1.3653, overnight range 1.3637-1.3687, close 1.3644
USDCAD is not any worse for wear despite broad-based US dollar safe-haven demand stemming from Trump’s attack on Iran. That’s because gold and oil prices soared and Canada has plenty of both.
The US dollar rallied across the board and 10-year Treasury yields remained below 4.0% due to the latest Trump-led geopolitical crisis.
The Iran news overshadowed Prime Minister Carney’s India fence-mending trip which appears to have been rather successful. Mr Carney announced a $2.6 billion uranium supply deal which Cameco had been working on for a few months.
It is also a big week for economic data including US nonfarm payrolls and retail sales on Friday. However, the Trump Iran war may diminish its impact.
US ISM manufacturing PMI is expected at 51.8 (previous 52.6).
USDCAD Technical Outlook
The intraday USDCAD technicals are rangebound in a 1.3630-1.3730 band but have a mildly bearish bias with a break of 1.3620 targeting 1.3550. A topside break target 1.3760.
The medium-term technicals are bearish below 1.3755-1.3800 area, leaving prices trapped inside a broad 1.3480-1.3780 band. A break below 1.3585 would reopen downside risk toward 1.3500 and 1.3400, while a sustained break above 1.3800 would argue for a move toward 1.3900.
For today, USDCAD support is at 1.3630 and 1.3610. Resistance is at 1.3710 and 1.3730.
Today’s Range: 1.3630-1.3720
Regime Change
Trump ordered an attack on Iran on Friday night, The US claimed that Ayatollah Khamenei and 47 other senior leaders were killed but any hopes for a quick end to the conflict have been put to rest. Iran has a vast, well-established, bureaucracy, most who are fervent believers in the theocratic republic and they are not going away quietly. Iran’s counterattacks have struck targets in Qatar, UAE, Israel, and Kuwait.
Global traders are the equivalent of rubberneckers gawking a messy, fatal car crash. Their focus is how they can profit, protect profits or mitigate losses from the US-Israel war on Iran.
The Strait of Hormuz, expressway for 20 million barrels of crude per day is effectively closed. Tankers are stacking up at each end of the narrow waterway in fear of being attacked by Republican Guards. Major shipping companies such as CMA CGA and Hapag Lloyd have suspended transit.
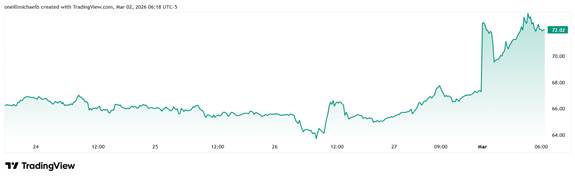
WTI oil prices have spiked to a peak of 74.99 after closing Friday at 69.34.the chart below Oil futures, (CL1)
Taking Stock
Asian equity markets closed with losses. Japan’s Topix dropped 1.02%, Hong Kong’s Hang Seng lose 1.02% and Australia’s ASX gained finished flat.
As of 5:30 am PT, European bourses are deep underwater, led by a 2.45% drop in the German Dax. The French CAC-40 is down 2.09% and the UK FTSE 100 has lost 1.31%. S&P 500 futures are down 0.95%, the DXY is 98.41, the 10-year Treasury yield is 4.017%, and gold (XAUUSD) is 5,399.68.
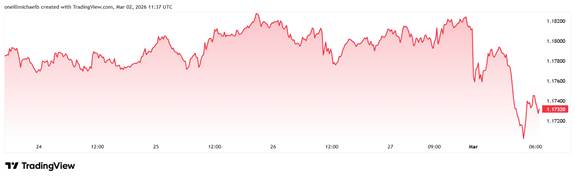
EURUSD
EURUSD traded lower in a 1.1698-1.1796 range. Prices plunged in Asia, then clawed back some losses in Europe. The war in Iran overshadowed key economic reports. Eurozone Manufacturing PMI rose to 50.8 in February (January 49.5), a 44-month high. The report noted that Dr. Cyrus de la Rubia, Chief Economist at Hamburg Commercial Bank, said, “This seems to be a broad-based recovery of the eurozone manufacturing sector, with six out of the eight surveyed countries now in growth territory.” German retail sales fell 0.9% m/m in January compared to the forecast of -0.2% and December’s 1.2% result. Chart EURUSD 5 day.
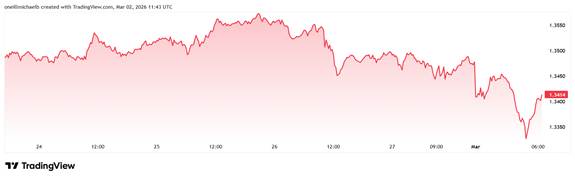
GBPUSD
GBPUSD dropped then popped in a 1.3314-1.3456 range, due to broad-based US dollar safe-haven demand. Uk data was positive with February Manufacturing PMI at 51.7 vs January at 51.8. S&P Global said the data suggests that the economic outlook remains positive. GBPUSD chart 5-days.
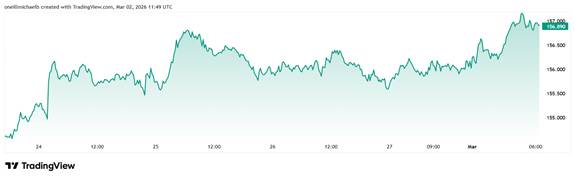
USDJPY
USDJPY rose from 156.02 to 157.25 on fears about increased risks to Japanese economic growth due to soaring oil prices from Trump’s war in Iran. Japanese Manufacturing PMI rose to 53.0 from 51.5 in January, which S&P said, “suggest that the recovery in the manufacturing industry gained pace.” Chart-5 days.
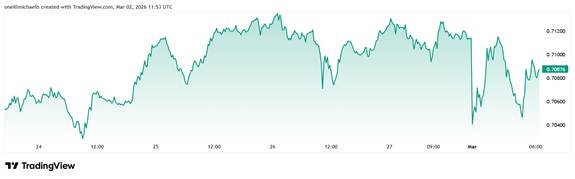
AUDUSD
AUDUSD dropped from 0.7117 to 0.7037 in Asia but recovered half of the losses into the NY open. TD-MI inflation was unchanged at 3.6% y/y in February while PMI came in at 51 vs 51.5 in January. The data was ignored. Chart 5 day
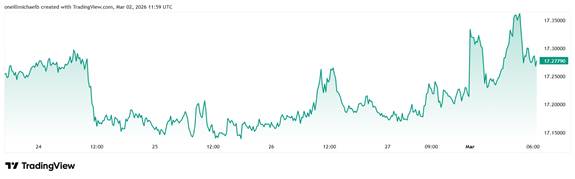
USDMXN
USDMXN traded in a 17.2257-17.3763 range and is trading at 17.2756 in early NY. Prices tracked broad US dollar movements. Chart 5-day
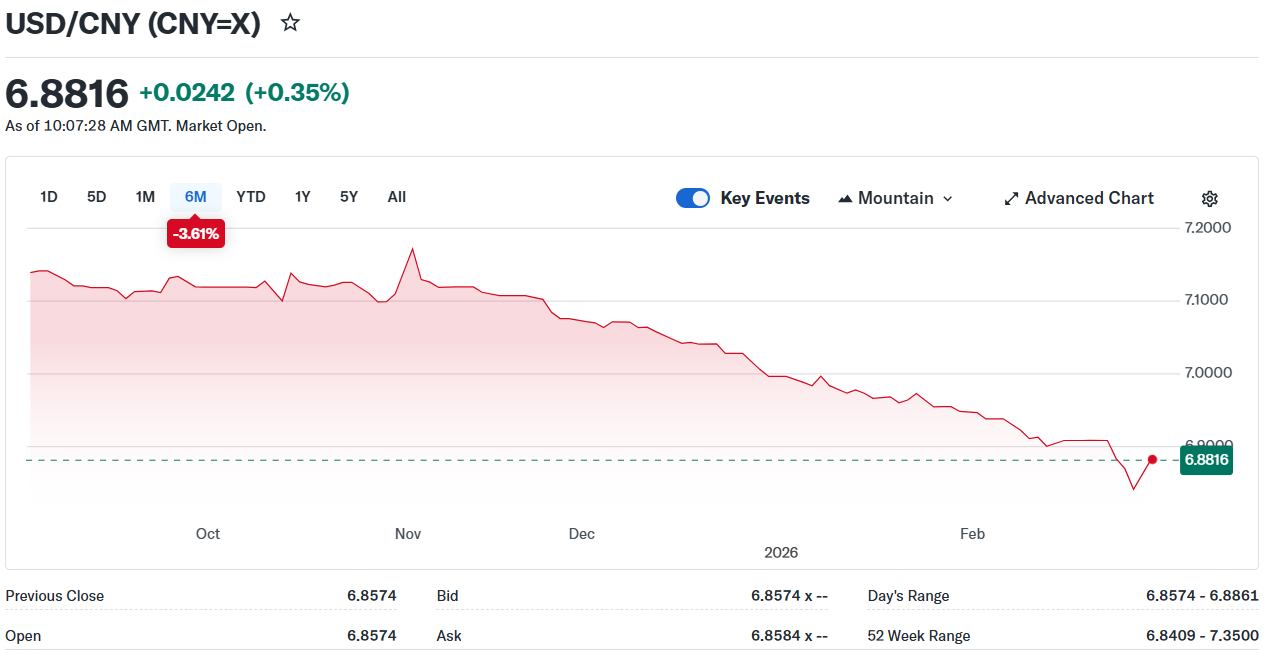
China
USDCNY Fix: 6.9236 vs exp. 6.8693 (Prev. 6.9228)
Shanghai Shenzhen CSI 300 rose 0.38% to 4,728.67
Chinese Foreign Minister Wang Yi “It is unacceptable to blatantly kill the leader of a sovereign state and instigate regime change,” (He may have muttered under his breath that Xi Jinping was totally opposed to it.)
China is Iran’s top destination for crude.
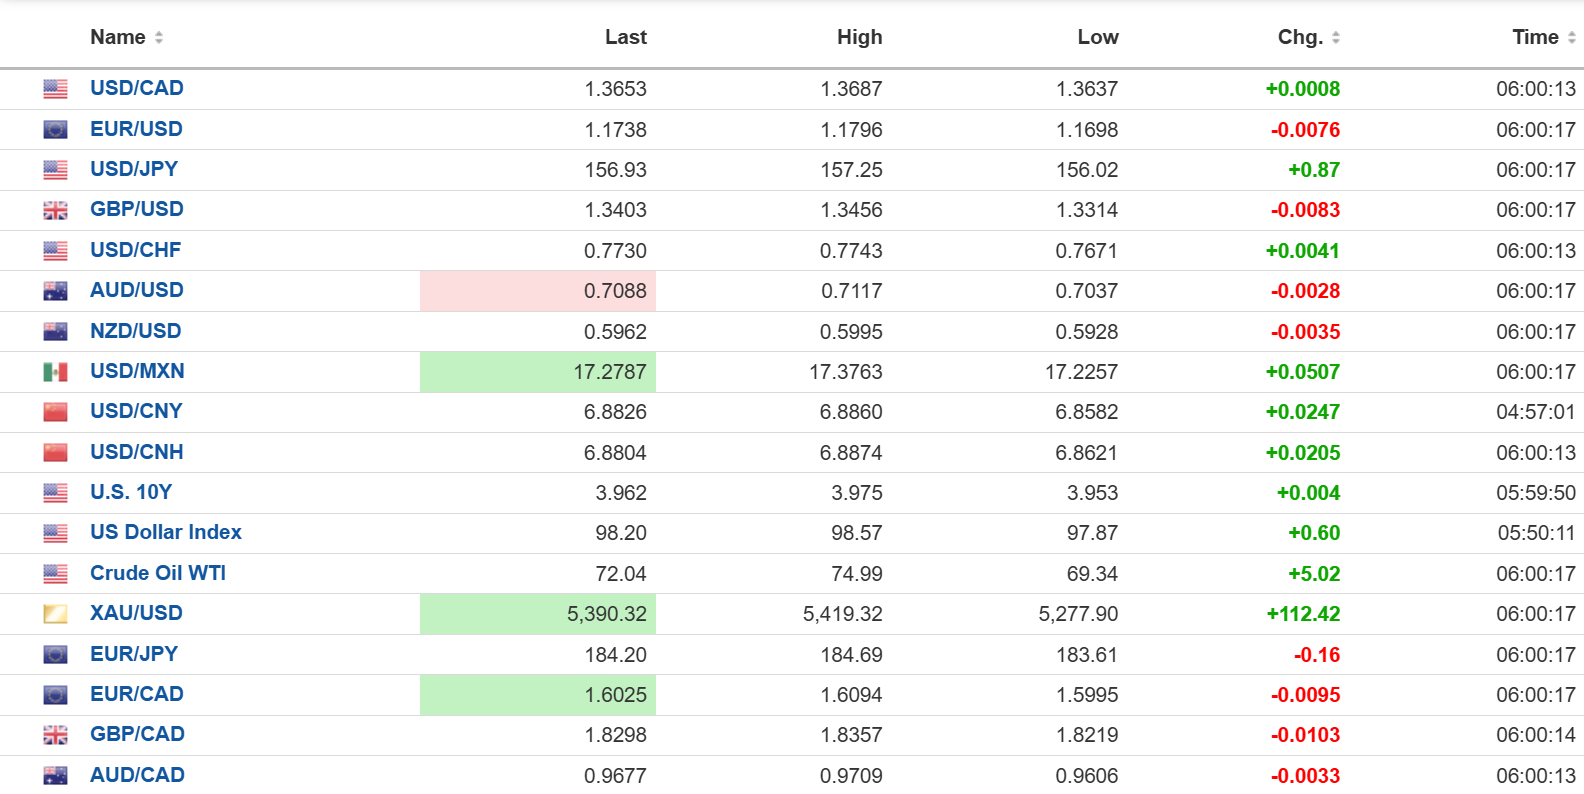
FX open high low
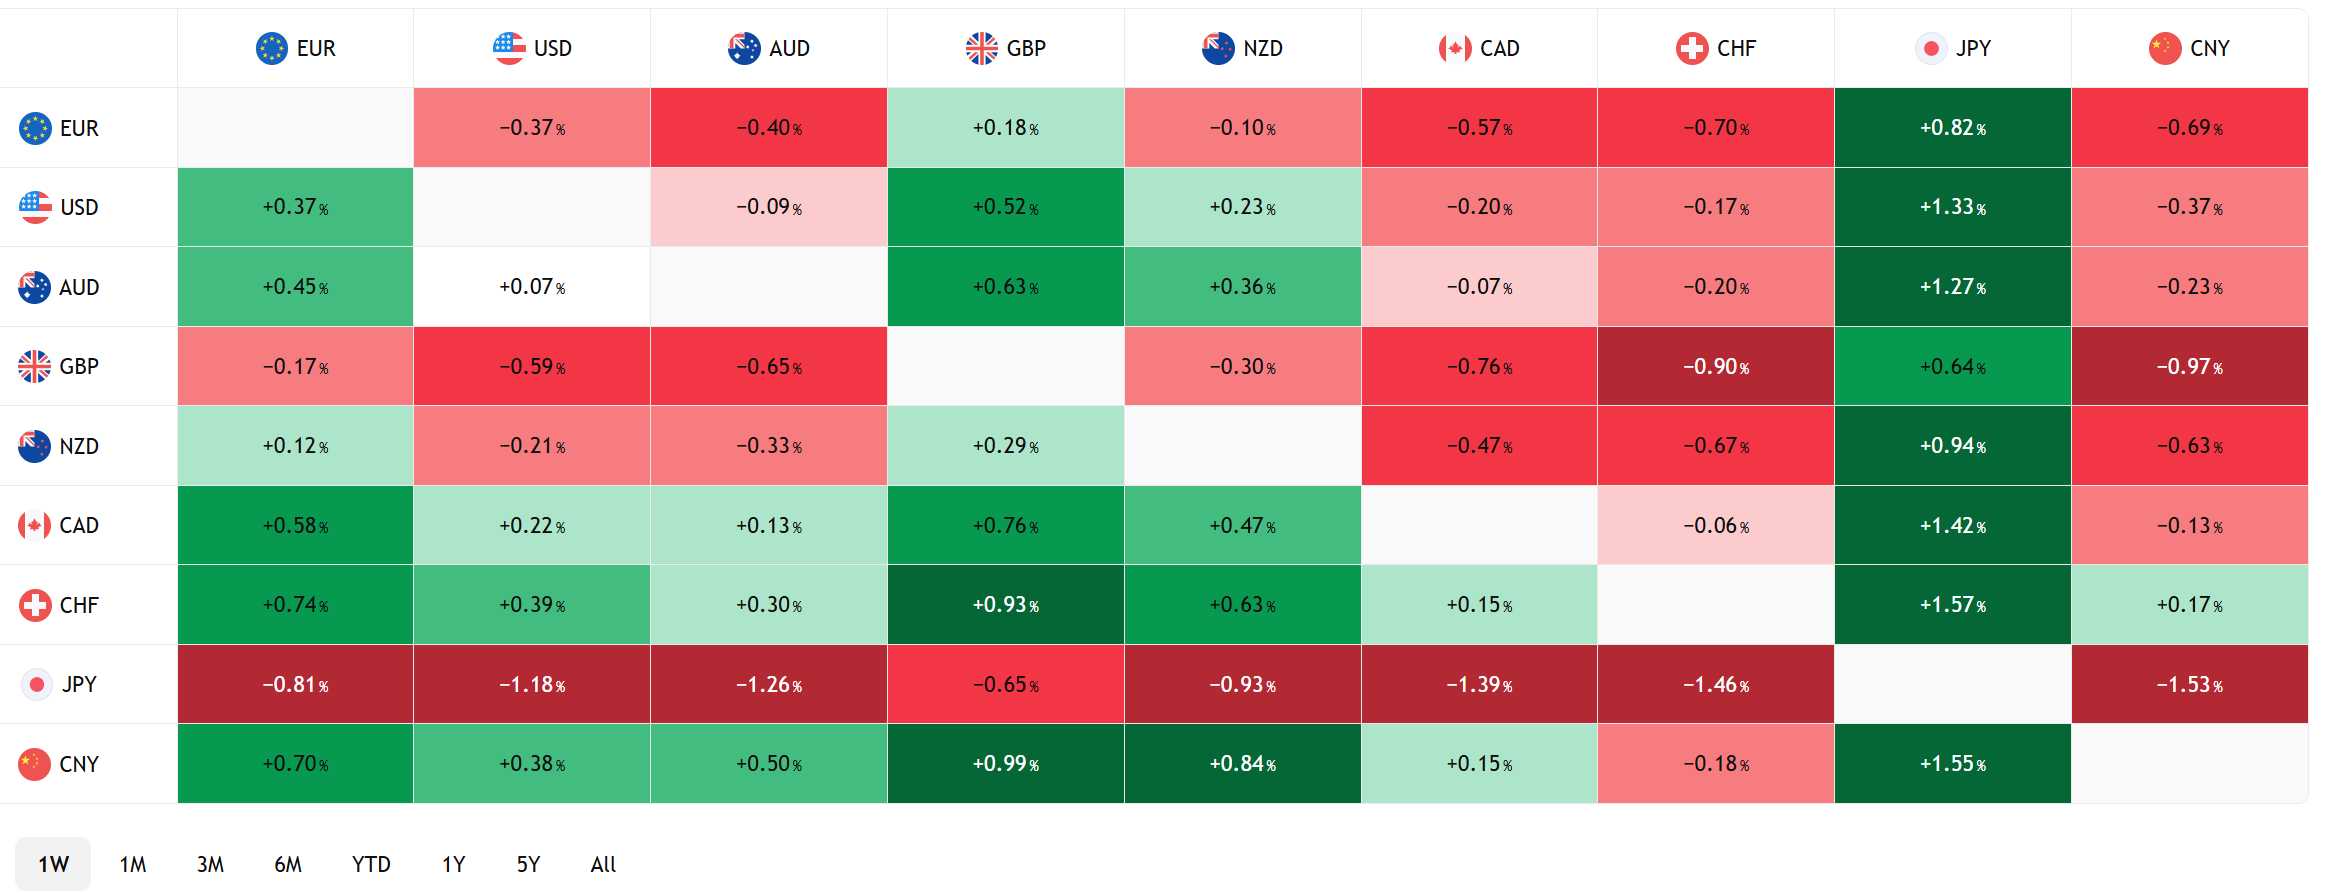
FX Heat Map (6:00 am) one week
Sources: Investing.com, Bloomberg, Reuters, Yahoo Finance, US Census Bureau, Trading Economics Tradingview