March 13, 2026
USDCAD open: 1.3670, overnight range 1.3621-1.3698, close 1.3642
USDCAD is back where it was last Friday after a week of drama stemming from two weeks of Trump’s war on Iran. Monday’s low of 1.3526 was largely due to Canadian dollar demand because of its status as a “petrocurrency” after WTI hit 119.48/b in Asian on Monday. Alas, traders are fickle. WTI rebounded from its 76.83 low on Tuesday to 97.99/b overnight and USDCAD rallied because of the inflationary impact of the oil price rise putting Fed rate hikes on the table.
Trump issued a 30-day waiver allowing Russian crude, already at sea to be purchased. All it does is pay Putin a higher price for his oil but does nothing to lower the price.
Canada’s job picture is UGLY. The country lost 83,900 jobs in February and the unemployment rate rose to 6.7% from 6.5%.. The employment decline in February was spread across services-producing industries (-56,000; -0.3%) and goods-producing industries (-28,000; -0.7%). Can you say Stagflation?
USDCAD rose from 1.3675 to 1.3698 on the news.
The Canadian data is likely to be overshadowed by developments in Trump’s war on Iran.
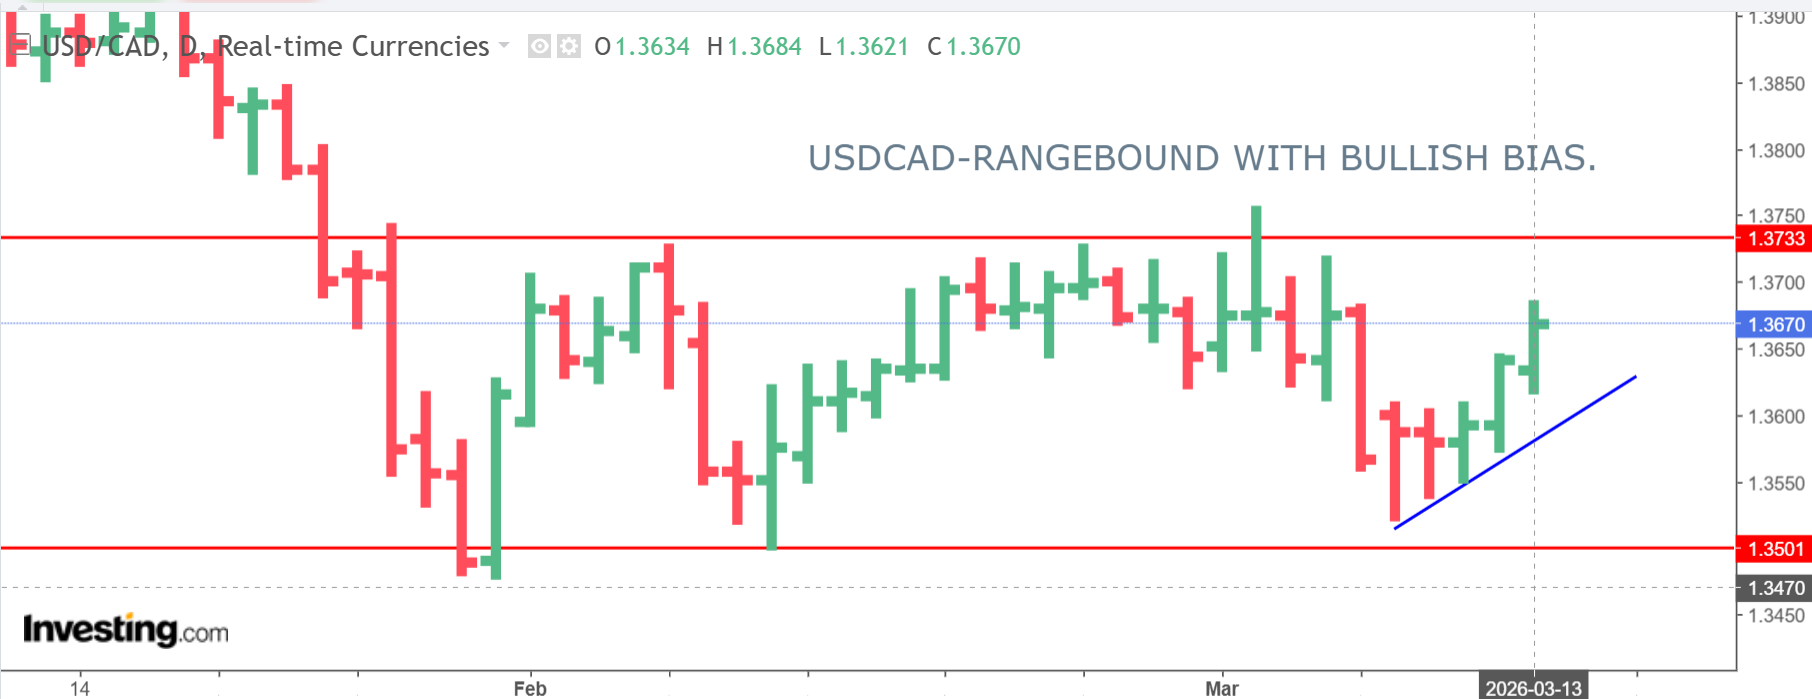
USDCAD Technical Outlook
The intraday USDCAD technicals are bullish while trading above 1.3630 and looking to break above 1.3705 to target 1.3720. A move below 1.3630 suggests a retest of support at 1.3680.
USDCAD is in a week-long uptrend that started at 1.3515 and remains intact while prices are above 1.3580. However, in the near term it will struggle to make gains above 1.3710 as the RSI on the 4-hour chart is at extreme over-bought levels. Price action above 1.3620 keeps the focus on 1.3710-20 zone then 1.3760.
For today, USDCAD support is at 1.3630 and 1.3580. Resistance is at 1.3710 and 1.3740.
Today’s Range: 1.3640-1.3730
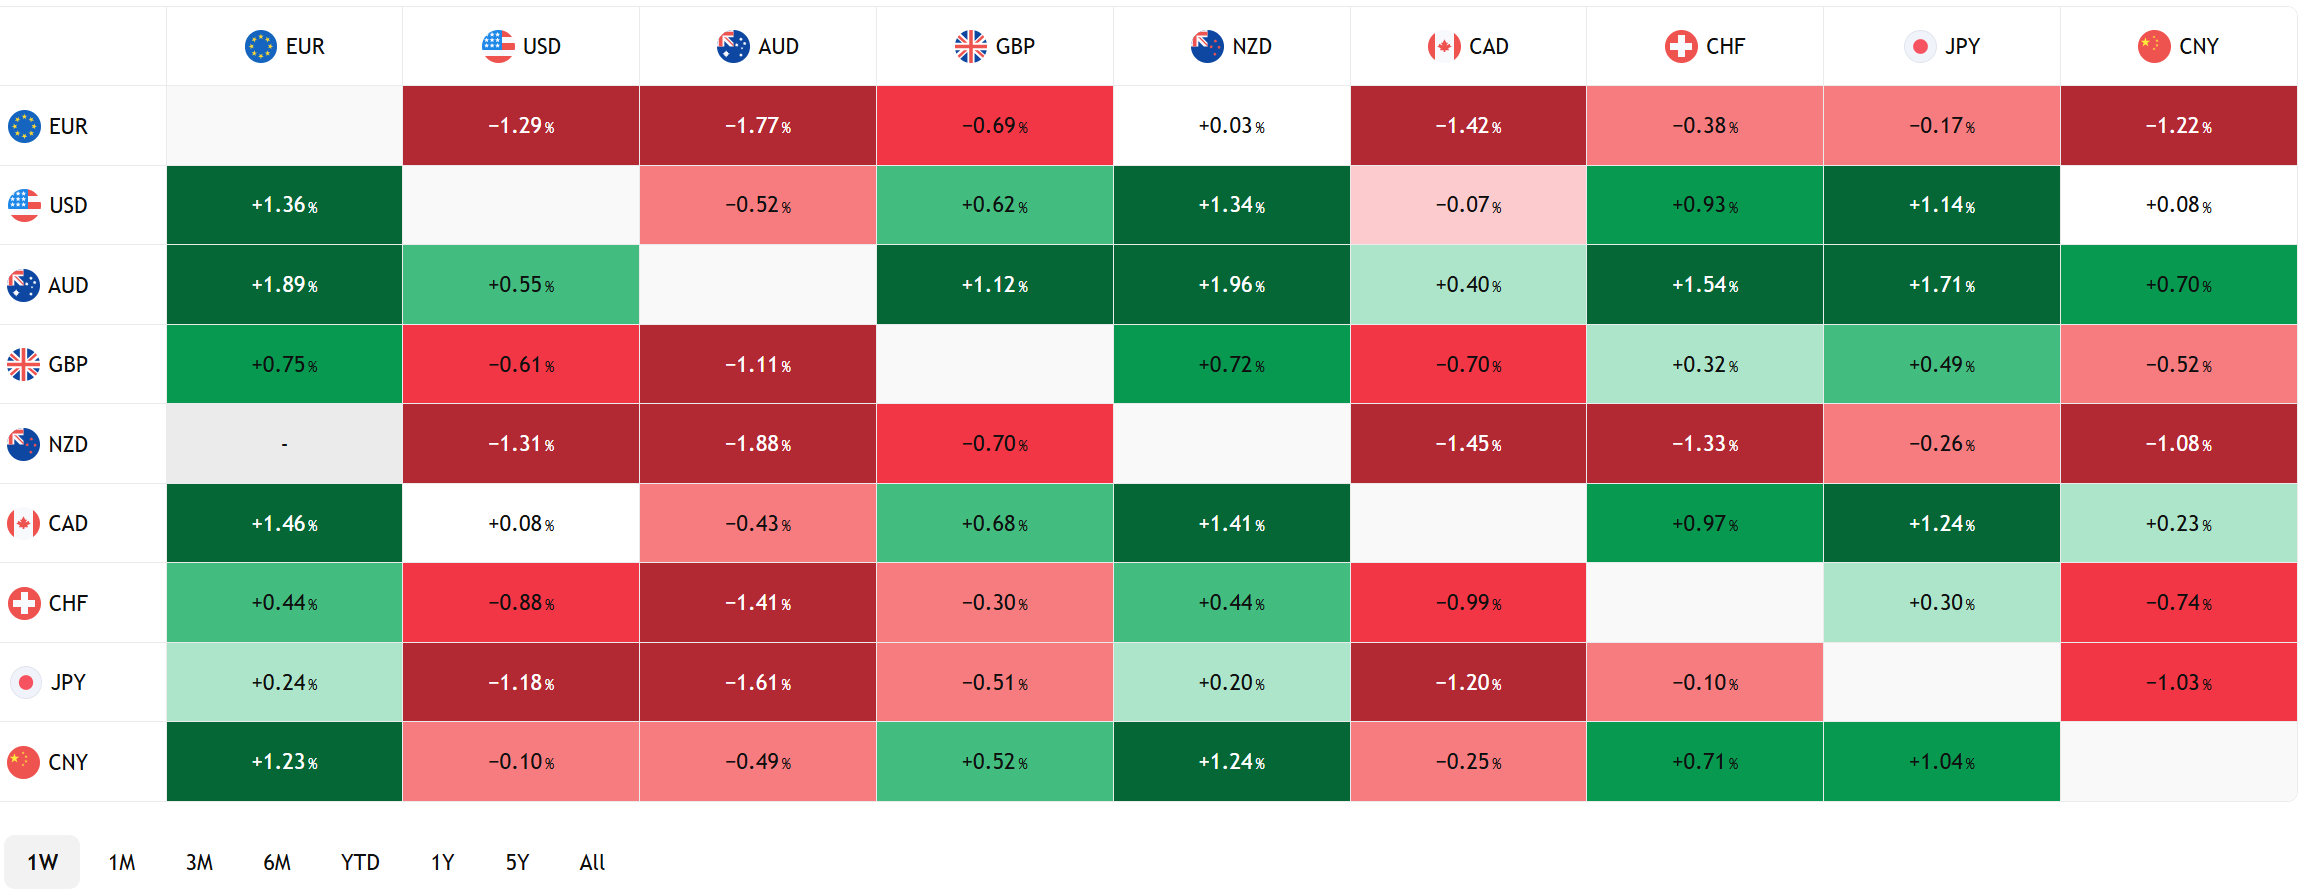
FX Heat Map (6:00 am) one week
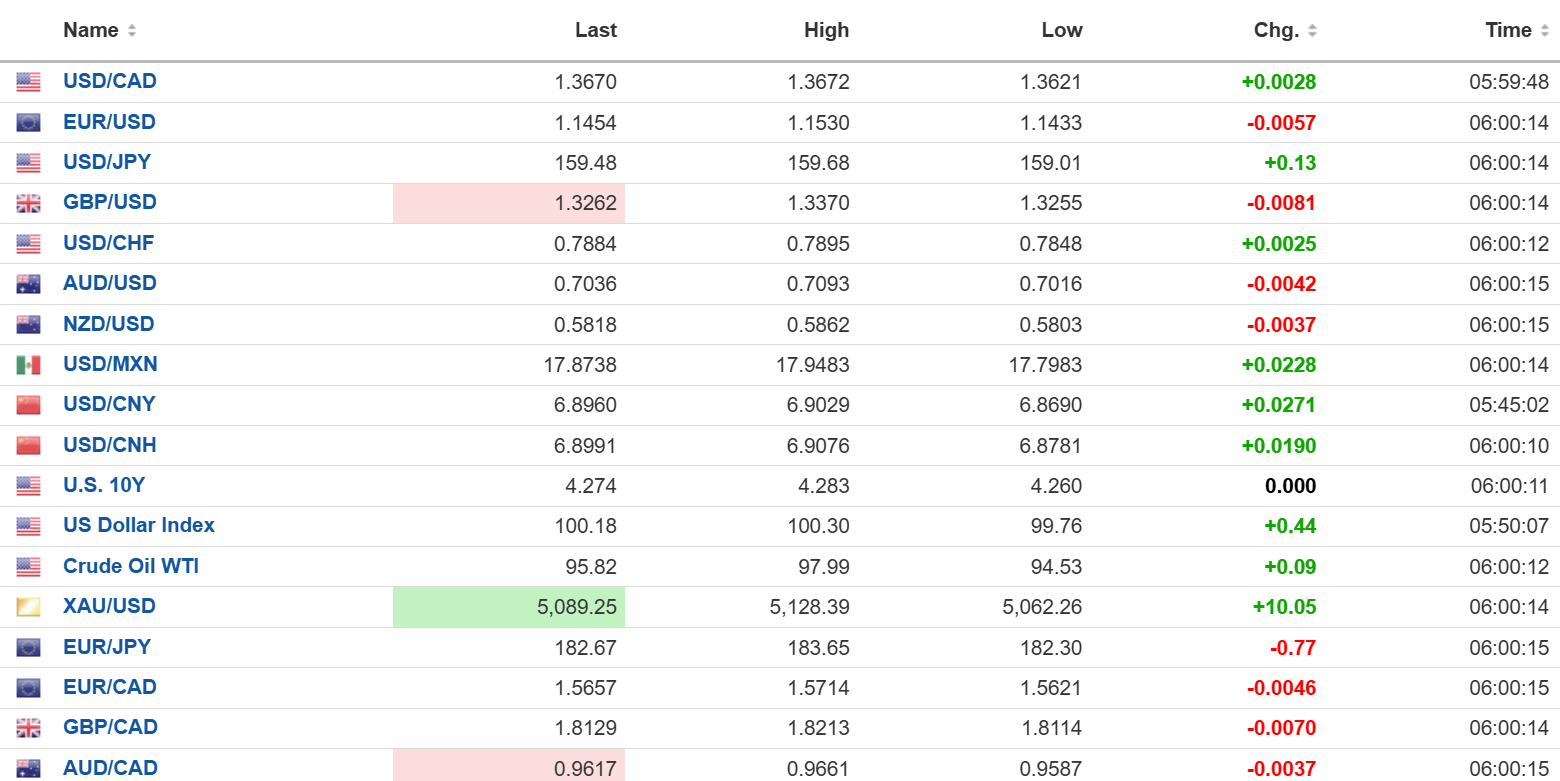
FX open high low 6:00 am
Overnight Round-up
Neutralizing Iran is not proving to be the cakewalk envisioned by Trump and his advisors. Americans are not hailing them as conquering heroes, saving them from the despotic ruler in a country about 11,000 kms from Chicago that most couldn’t even find on a map. That’s because what they see is around a 20% jump in the price of gas at the same time as they are dealing with a rising cost of living from Trump’s (illegal) tariffs.
Those costs will be on full display today. Durable Goods Orders, ex-transportation, are expected to rise just 0.5% m/m, compared to 0.9% in January, although weather will have been a factor.
US core-PCE price index was unchanged at 0.4% m/m in January while core-CPI rose 3.1% y/y as expected. US Q4 GDP rose just 0.7% y/y but Trump’s Iran war should give GDP boost inn Q 1.
Trump is not satisfied with wreaking havoc upon the global economy with its attack on Iran. It is dusting off another tariff playbook. Section 301 refers to a provision of the US Trade Act of 1974 that gives the president broad authority to impose tariffs or other trade restrictions on foreign countries whose trade practices are deemed “unfair.”
Taking Stock
Asian equity markets followed Wall Street indices lower. Japan’s Topix dropped 0.57% overnight and 1.05% over the past 5 days. Australia’s ASX 200 lost 0.14% and 3.62% for the week while Hong Kong’s Hang Seng fell 0.98% but managed to squeeze a 0.42% gain for the week.
As of 5:40 am PT, European markets are mixed to flat. France’s CAC 40 is down 0.28%, and Germany’s DAX and the UK FTSE 100 are all either side of unchanged. S&P 500 futures have climbed 0.41%, and the 10-year Treasury yield is 4.247%.
EURUSD
EURUSD lost 0.47% compared to its close of 1.1514 and traded in a 1.1433-1.1530 range overnight. The single currency is on the defensive due to high crude prices and broad-based US dollar demand. Eurozone Industrial Production fell 1.5% in January compared to the forecast for a 0.6% gain.
GBPUSD
GBPUSD is down 0.53% from yesterday’s NY close and it is trading just above the bottom of its 1.3253-1.3370 range. Widespread US dollar demand was already weighing on the currency pair when it was broadsided by a slew of weaker-than-expected economic data. The most damaging was GDP in January, which was 0 compared to expectations of 0.2% growth.
The ONS wrote: “Monthly GDP showed no growth, following growth of 0.1% in December and 0.2% in November 2025. Services showed no growth, production fell by 0.1%, and construction grew by 0.2% in January 2026.”
USDJPY
USDJPY is in the middle of its 159.01-159.68 range and there is no sign of intervention from the BoJ. The surge in oil prices, expectations for the BoJ to leave rates unchanged, and the outlook for a hawkish Fed meeting are driving prices higher.
AUDUSD
AUDUSD gave back some of this week’s gains and traded in a 0.7016-0.7093 range. AUDUSD downside is supported due to the belief that the RBA will raise rates next week and deliver a hawkish outlook.
USDMXN
USDMXN traded firmer in a 17.7983-17.9483 range due to general US dollar strength. The topside has some resistance as the recent tick higher in inflation may keep Banxico on the sidelines at its March 26 meeting.
China
USDCNY Fix: 6.9007 vs exp. 6.8888 (Prev. 6.8959)
Shanghai Shenzhen CSI 300 fell 0.39% to 4,669.14
Sources: Investing.com, Bloomberg, Reuters, Yahoo Finance, US Census Bureau, Trading Economics Tradingview