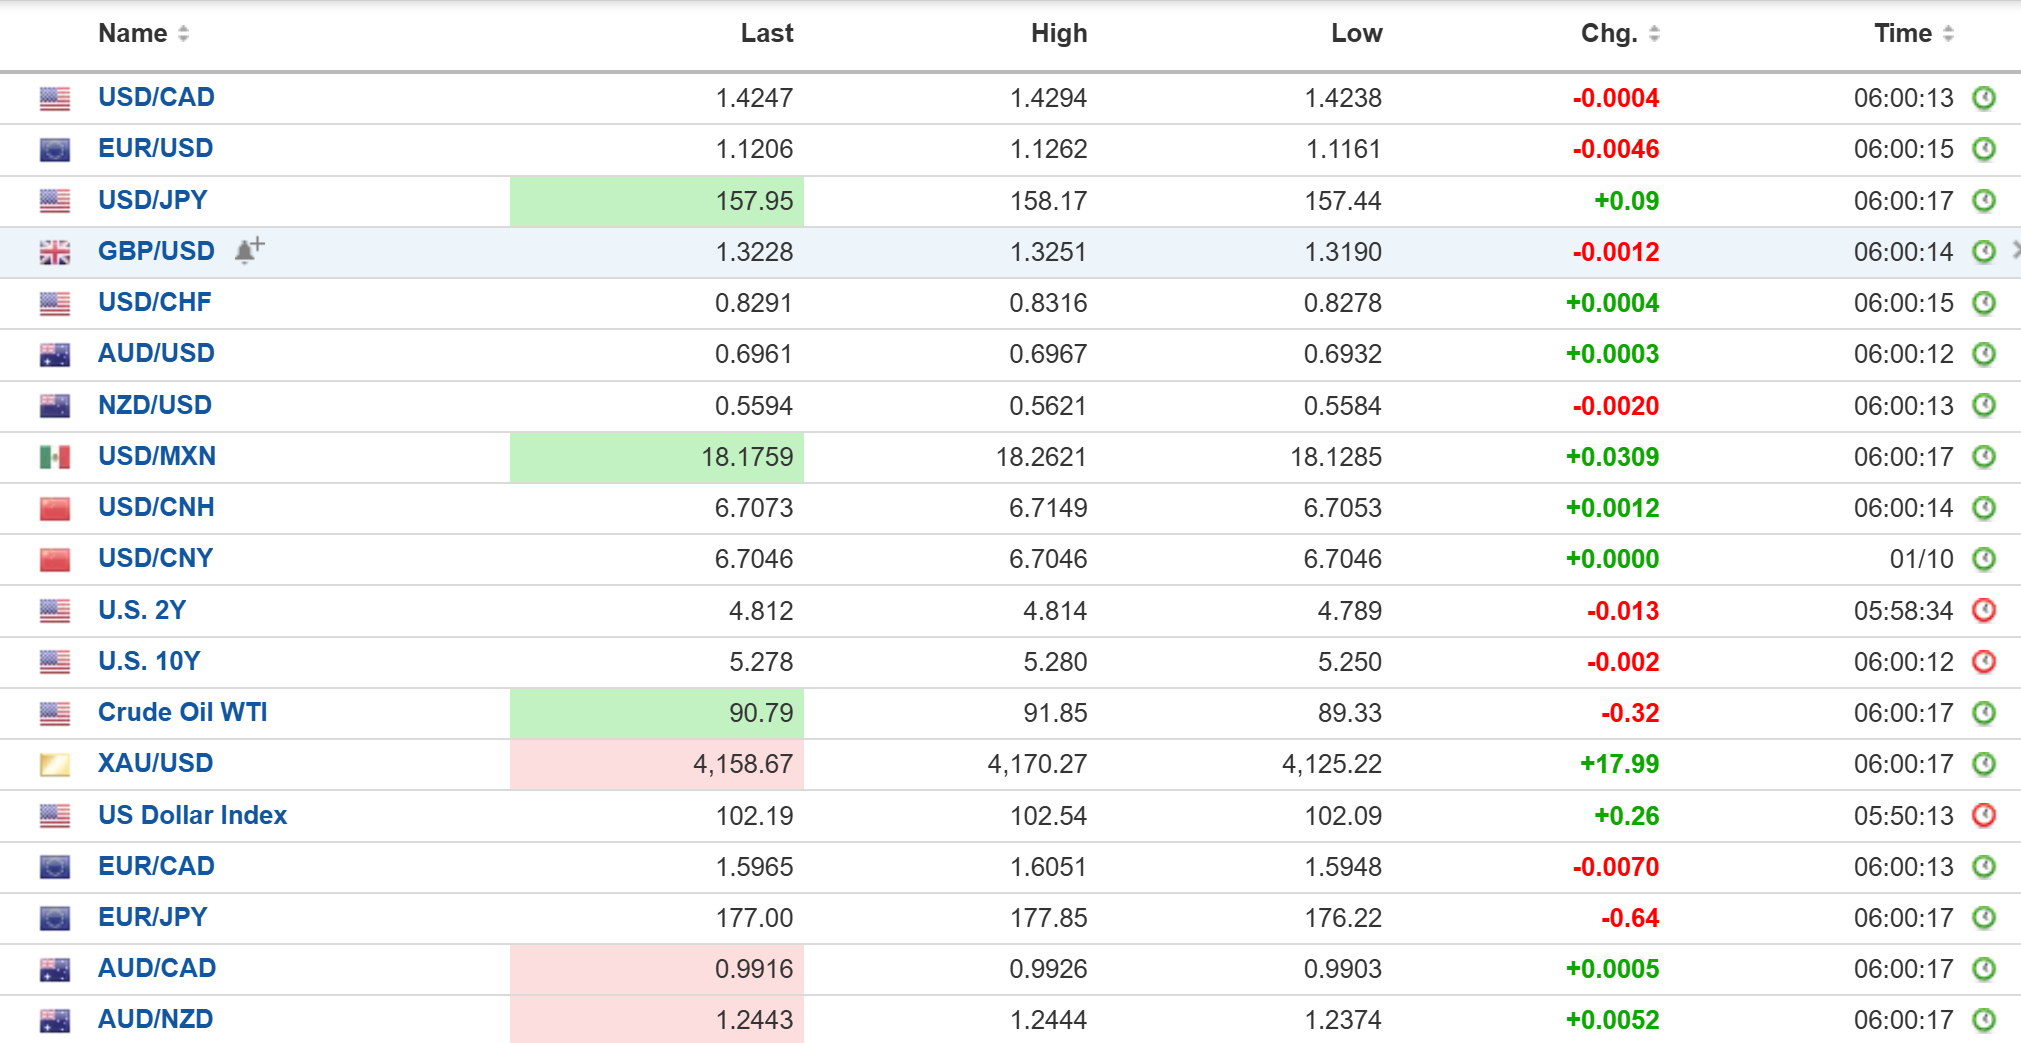
USDCAD open (6:00 am): 1.4247 overnight range 1.4238-1.4294, close 1.4249
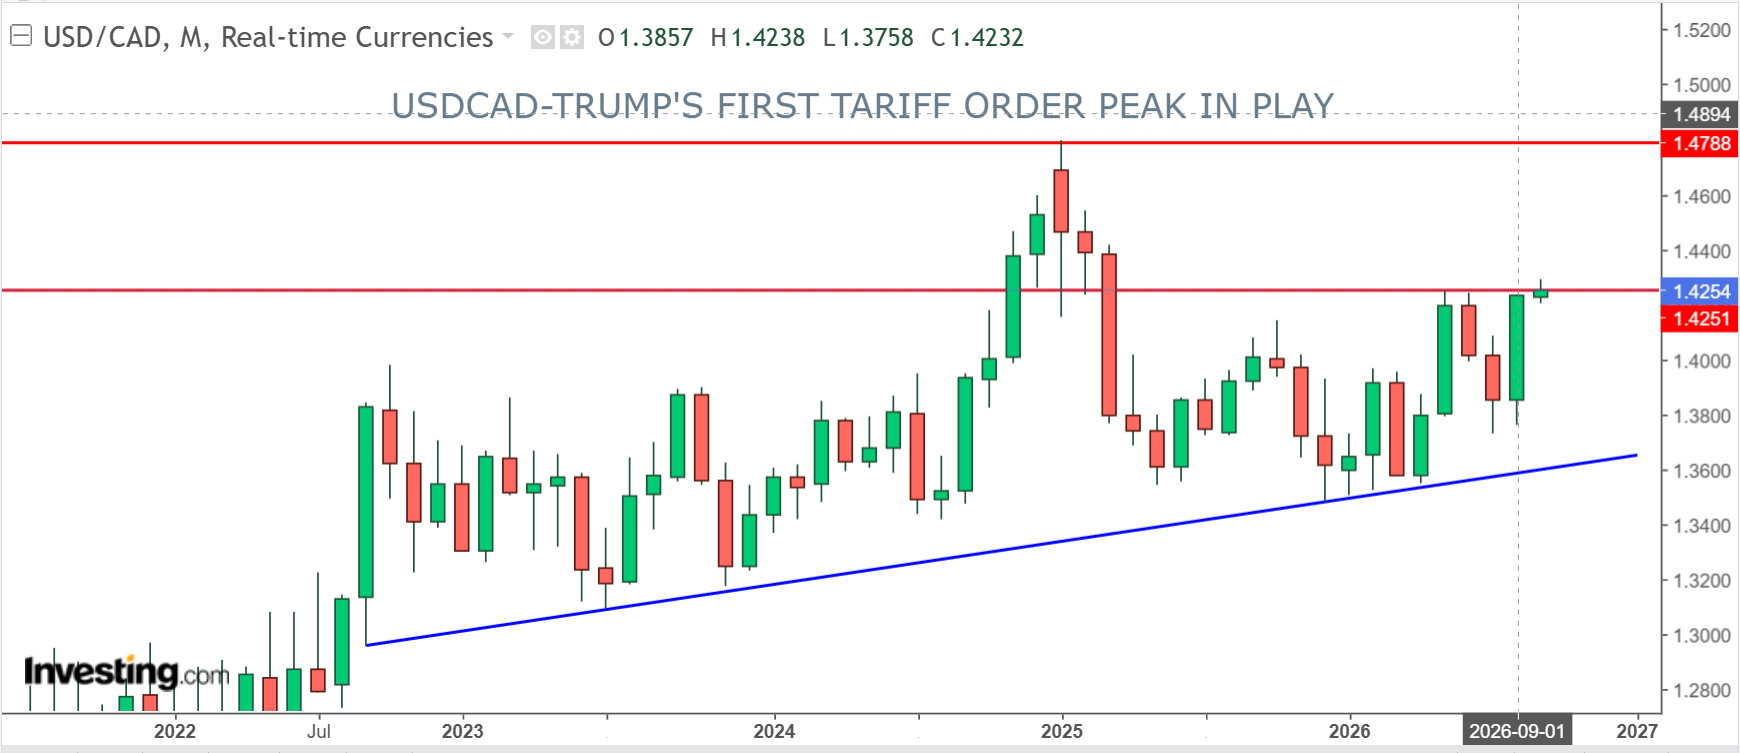
USDCAD continued to grind higher overnight and if the gains above 1.4250 are sustained it puts the February 2, 2025 peak in play. That’s the day, Trump threatened to impose across-the-board 25% tariffs on Canadian goods. What once was viewed as merely a negotiating tactic is quickly becoming a reality.
U.S. tariffs are reshaping Canada’s auto industry, with the damage extending well beyond the headline moves by GM and Stellantis. GM has cut production at Oshawa and left much of its CAMI plant idle, while Stellantis has shifted some production and investment south of the border to avoid tariffs.
The bigger concern is investment. Roughly 42% of Canadian manufacturers have either moved production to the U.S. or are considering it as companies try to get behind the tariff wall. Toyota and Honda, which account for more than 75% of Canada’s vehicle production, have delayed or frozen some Canadian investment while they wait for greater clarity on trade rules. Ford is maintaining its Canadian operations but has pulled back on major EV expansion plans.
WTI oil is not providing much of a cushion even though prices are trading in a $89.33-$91.85 range. The G7 agreed to release 100 million barrels of diesel from emergency stocks to avoid Trump’s threat of a diesel export ban. At the same time he said the US will soon replenish its Strategic oil reserves. Opec announced it would keep production quotas unchanged.
The only data of note is today’s US ISM Services PMI data (forecast 55, August 55.4)
USDCAD Technical Outlook
The intraday USDCAD bias is bullish while trading above 1.4220 and looking to retest the overnight high at 1.4294. The uptrend channel from September 9 is intact and bound by 1.4220 on the bottom and 1.4310 on the top. However, the overnight spike above the June peak was quickly sold, and USDCAD is now treading water around the 4-hour mid-Bollinger Band at 1.4241. The 4-hour MACD and RSI momentum indicator s have flattened, and suggest a period of consolidation before the next leg higher.
Longer term, USDCAD closed September at 1.4233 after a 475-pip monthly rally from the September 9 low of 1.3760, clearing the 61.8 Fibonacci retracement of the January 2025 to January 2026 decline at 1.4184. The monthly chart shows the pair pressing against horizontal resistance at 1.4250, which has capped every rally this year. Today’s failed push to 1.4294 left a long upper wick on the daily chart, and the daily RSI has eased to 84 from 89, a hint that buyers are tiring. A decisive break above 1.4294 would put Trump’s first tariff order peak at 1.4788 in play.
For today, support is 1.4220 and 1.4180. Resistance is 1.4295 and 1.4320. Todays range 1.4210-1.4290
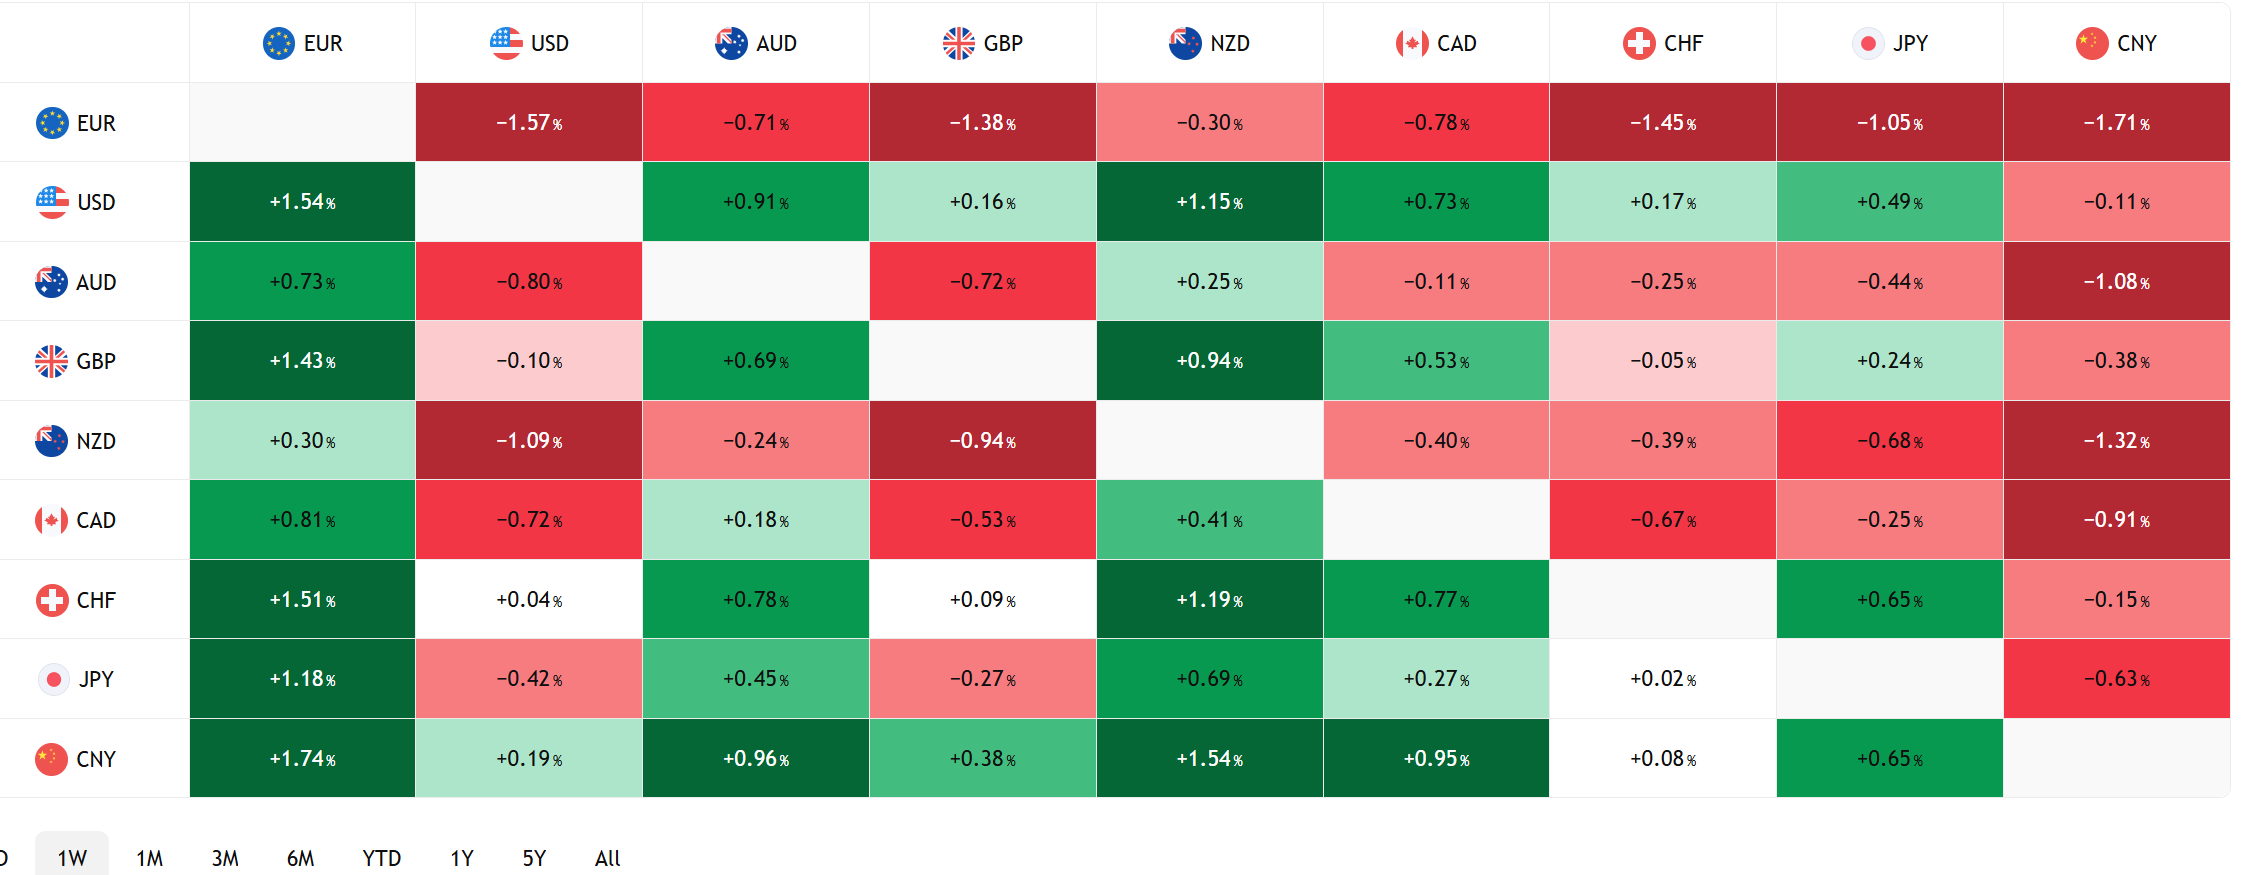
FX Heat Map
FX open high low 6:00 am
Dollar Bid Despite Weak Jobs Data.
Friday’s US payrolls report was soft, but the ensuing dollar weakness was shallow and short-lived after Treasury yields bounced from a low of 5.18% to 5.29% by the end of the day.
Fed officials tried to talk down rate hike risks, with Chicago Fed President Austan Goolsbee saying the inflation side of the Fed’s job is more important and that there is plenty of room for anything on the table, from a hike to a pause. His comments echoed those of NY Fed President John Williams, who said that there was no urgency to raise rates.
Iran and Trump Trade Threats
Iran says the Strait of Hormuz will not reopen until its conditions are met, while President Trump says he will decide on Iran and that the only question is whether it is the easy way or the hard way.
The US pulled its B-1 bombers out of the UK’s Fairford base amid threat concerns, Houthis hit a Saudi Aramco facility in Riyadh with missiles and drones, and there are reports that a tanker was struck in the Strait of Hormuz.
Taking Stock
Asian equities closed higher. Hong Kong’s Hang Seng rose 0.22%, Japan’s Topix gained 1.33%, while Australia’s ASX finished flat.
As of 5:40 am PT, the German DAX has gained 0.20%, the UK FTSE 100 is up 0.55%, and the French CAC-40 has lost 0.72%. S&P 500 futures are flat. The US 10-year Treasury yield is 5.288%, the DXY is 102.19 and gold is $4,162.22.
EURUSD | Range 1.1161-1.1262
EURUSD hit its lowest level since May last year, with France supplying the bad news and a firmer dollar rubbing it in. The euro remains the market’s favourite punching bag, with French political and fiscal turmoil leading the charge. Student protests are expected to close as many as 500 schools today, while last week’s French bond sell-off still lacks a credible fiscal response. Weak Sentix confidence (actual 2.7 vs 5.1 in August) weighed on EURUSD. China’s new anti-dumping probe into European chemical exports added another headache.
GBPUSD | Range 1.3190-1.3251
Sterling dropped then popped and is in the middle of its overnight band in early NY trading. UK final PMIs of 52.0 for composite and 52.1 for services, both of which topped the 51.7 forecast, provided a modicum of support.
USDJPY | Range 157.44-158.29
USDJPY traded choppily due to a mix of policymaker comments and broad US dollar strength. Japan’s Prime Minister Sanae Takaichi “pledged” to control bond issuance in a nod to antsy investors. Former BoJ board member Asahi Noguchi said Japan no longer needs reflationist policies and that the BoJ would hike rates in December. Jibun Bank services PMI printed 51.3 versus 51.6 expected.
AUDUSD | Range 0.6932-0.6968
AUDUSD dropped in Asia and then recovered most of its losses in Europe. Composite PMI was 51.3 (forecast 50.8) and services was 51.9 (forecast 51.4), but the news was offset by cooling inflation. The TD-MI inflation gauge fell to 2.8% y/y from 4.8%.
USDMXN | Range 18.1112-18.2621
The peso gave back all of its 2026 gains when USDMXN broke above 18.1700, and it consolidated the gains overnight. Narrowing MXN and US interest rate spreads and a Banxico on pause have combined to drive prices higher.
CHINA
Chinese markets are closed for Golden Week Oct. 1-Oct. 7.
- PBoC Fix: Market closed
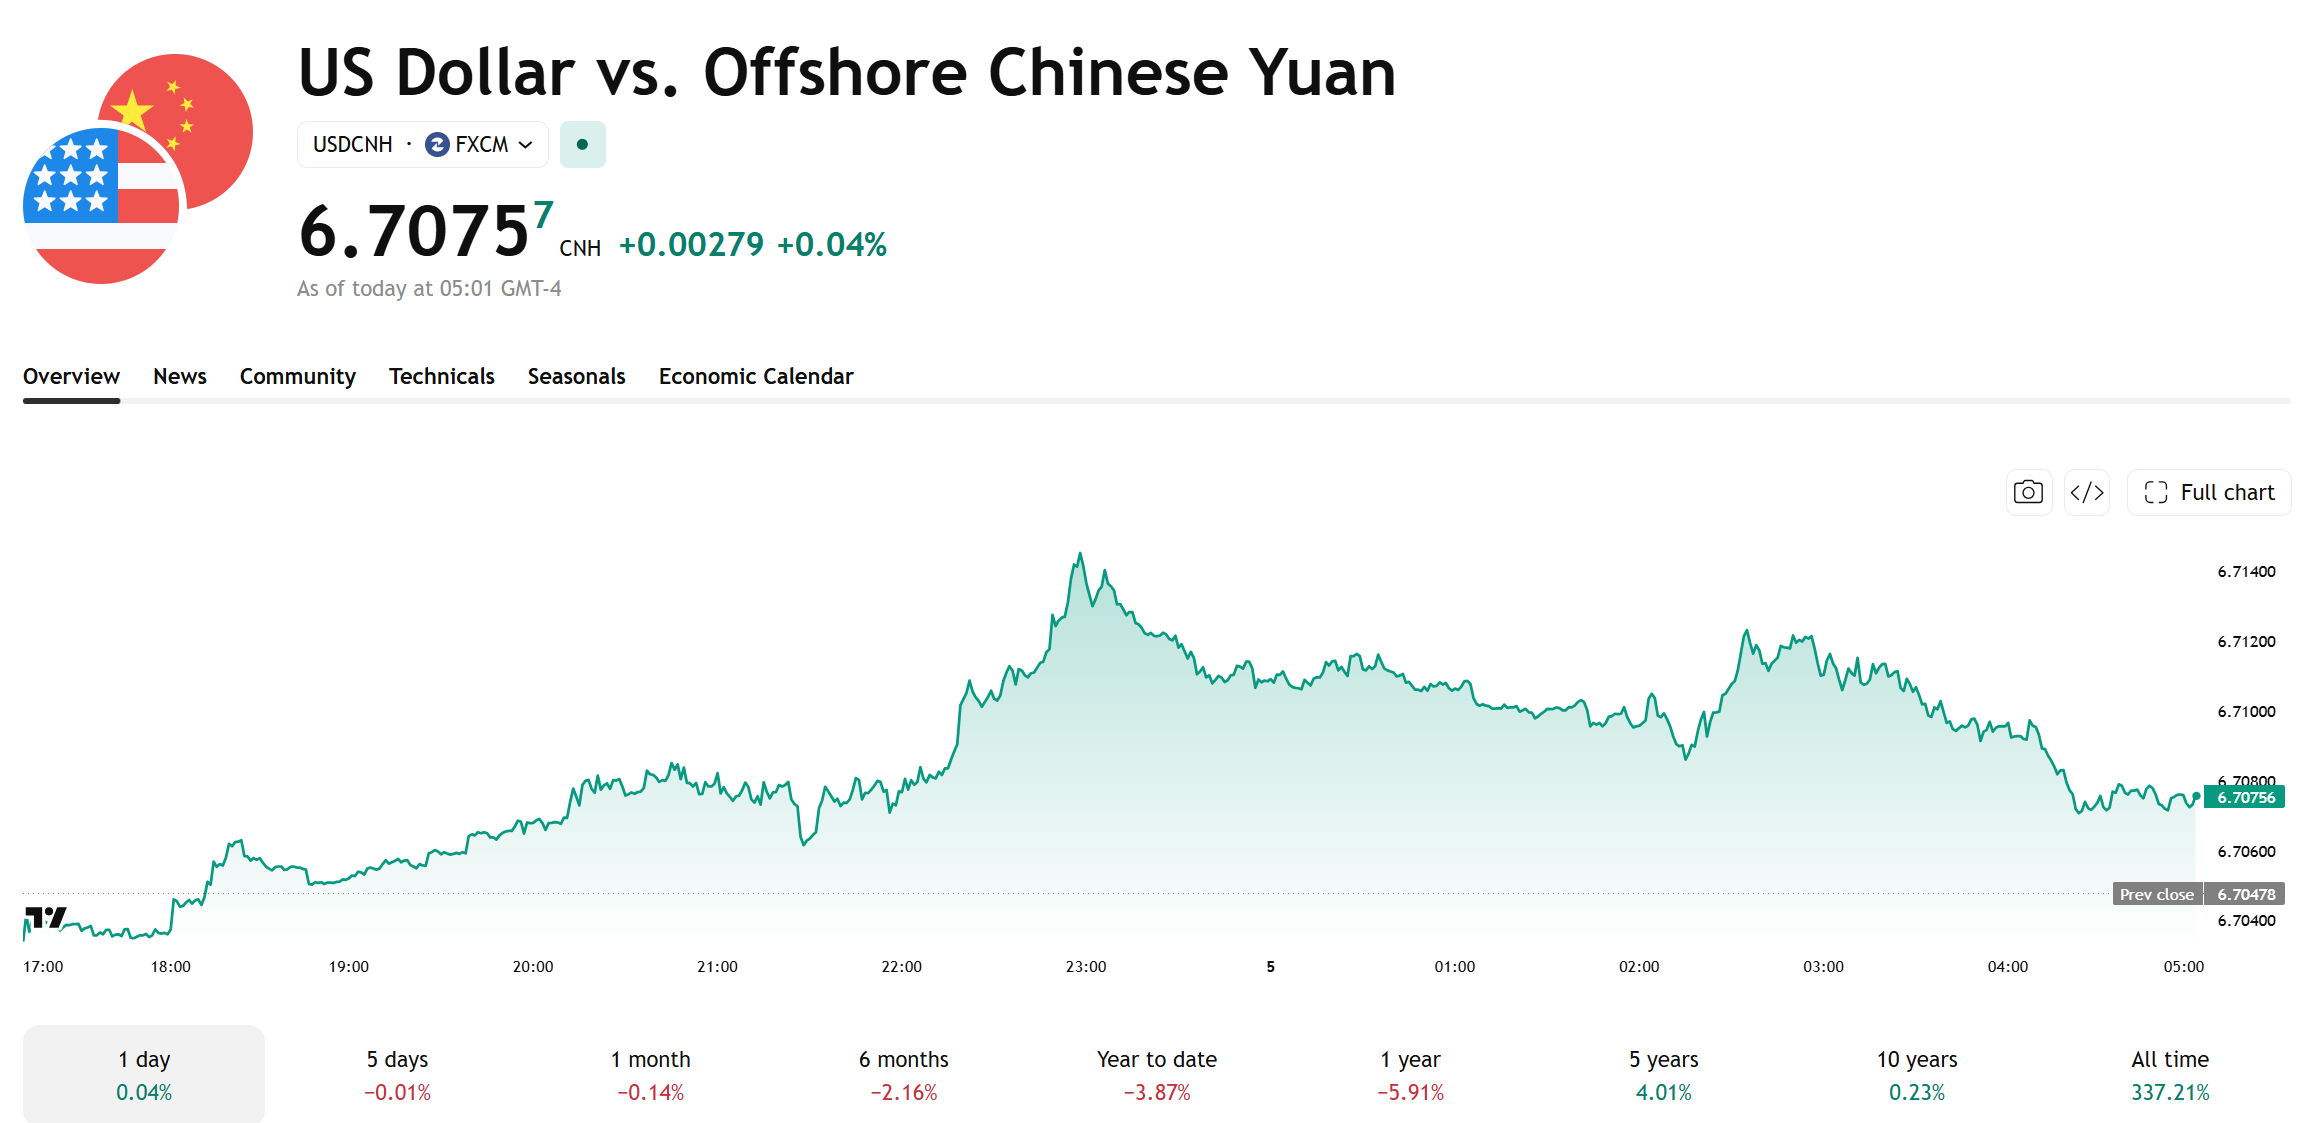
- USDCNH: 6.7054 (-0.0078)
- Shanghai Shenzhen CSI 300 Closed (last 4,357.62 on September 30)
Chart: Offshore yuan USDCNH
Sources: Investing.com, Bloomberg, Reuters, Yahoo Finance, US Census Bureau, Trading Economics, Tradingview