
Image by DALL-E,
December 22, 2023
- Loonieviews resumes on January 2, 2024
- Canada Oct GDP weaker than expected.
- US dollar consolidating yesterday’s losses.
FX at a glance
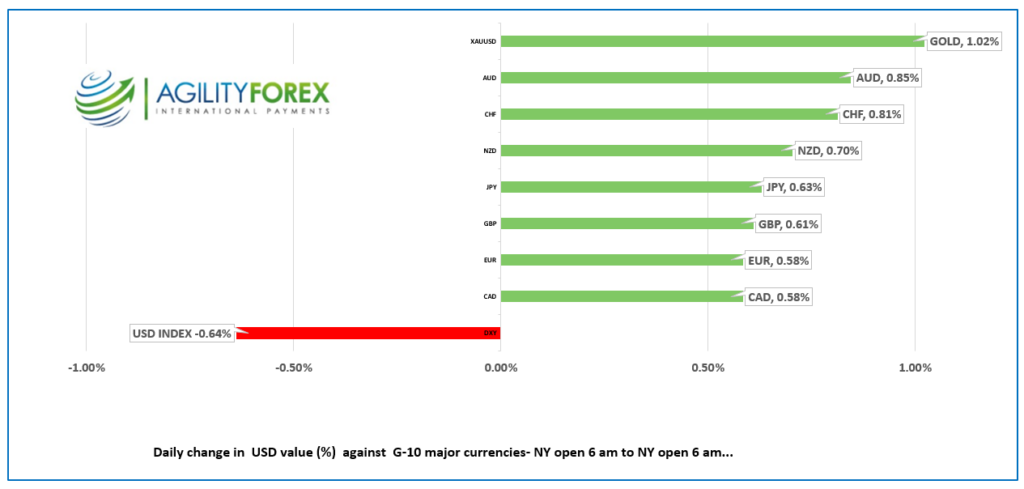
Source: IFXA
USDCAD Snapshot: open 1.3273-77, overnight range 1.3269-1.3293, close 1.3282
The Canadian economy flat-lined in October which was the third consecutive flat reading and weaker than the Statistics Canada prediction of 0.2% growth. The Canadian results pale in the face of the 4.9% Q3 GDP growth seen in the US and is another reason why USDCAD losses should be limited.
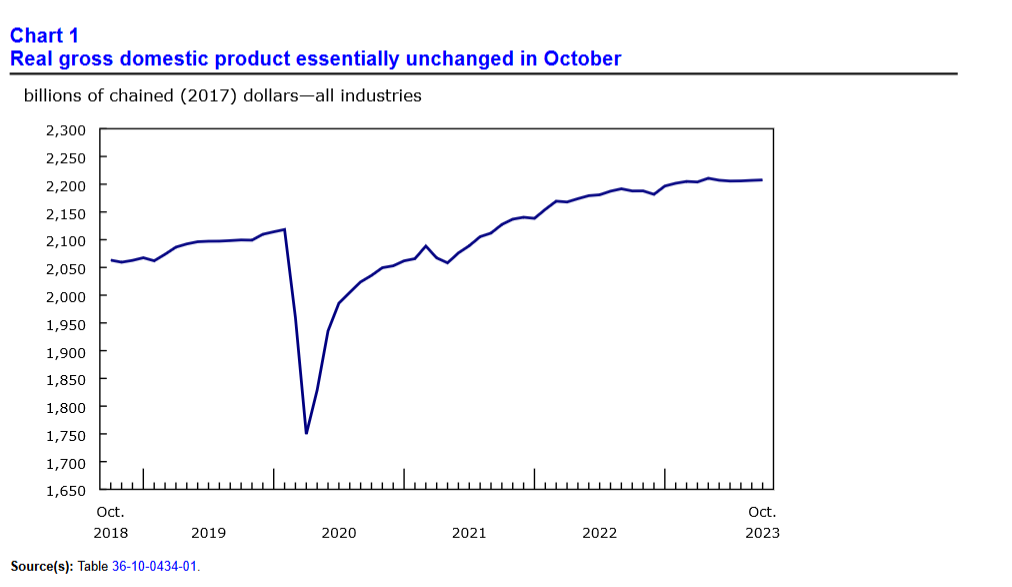
Source: Statistics Canada
Yesterday, USDCAD dropped from 1.3376 to 1.3276 before consolidated the losses in a narrow range overnight. It would be tempting to attribute yesterdays sell-off to the better than expected October Retail Sales-ex Autos data (actual 0.6% m/m vs forecast 0.5% and 0.1% in September. But it would be wrong. The data is stale, and it will have zero impact on the BoC rate decision on January 24.
USDCAD is being pressured by weaker than expected US economic data that reinforces the Fed March rate cut scenario. However, the selling pressure may also be due to month end and quarter end flows. The S&P 500 index is up 3.92% month-to-date and 10.7% so far this quarter. That suggests a whole lot of US dollar selling to rebalance portfolios and price moves may be exaggerates by poor liquidity because of year end.
WTI oil prices inched higher overnight rising from $73.81 to $74.89/b due to supply disruption concerns due to attacks on Red Sea shipping.
USDCAD Technicals:
The intraday USDCAD technicals are bearish while prices are below 1.3340 and looking for a break below 1.3260 to extend gains to the 1.3200-10 support zone. A decisive break below 1.3200 targets 1.2950. A move above 1.3340 merely interrupts the downtrend as the longer term downtrend is intact below 1.3580.
For today, USDCAD support is at 1.3260 and 1.3220. Resistance is at 1.3330 and 1.3360. Today’s range 1.3230-1.3330.
Chart: USDCAD daily.
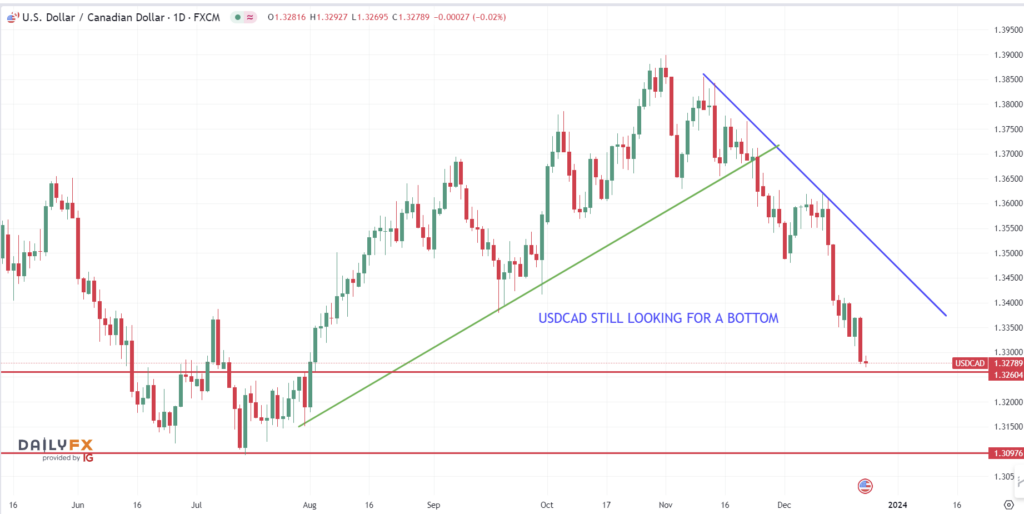
Source: Daily FX
G-10 FX recap
It’s the final trading day for many, who will soon start their extended Christmas or seasonal break until January 2, 2024. Yesterday’s softer-than-expected US Q3 GDP and weak Philadelphia Fed manufacturing survey data supported the dovish Fed view. Today’s -0.1% m/m drop in Core PCE price index (the Fed’s preferred inflation measure) helped justify why the odds for a March rate cut are now 77%. raising the likelihood of a March 20 rate cut to 72.7%.
Durable Goods Orders rose 5.4% in November (forecast 2.2%) and Michigan Consumer Confidence data is ahead. The US 10-year Treasury yield remains steady at 3.88%.
Turkey hiked its benchmark rate by 250 basis points to 42.5% after the economic genius wannabe, Recep Erdogan failed attempt to combat inflation by cutting rates. Mr Erdogan believed that cutting rates would encourage investment and spending even though his actions boosted inflation to 85.5% in October 2022. It has dropped to 61.3% in October 2023.
EURUSD traded in a 1.0994-1.1024 range overnight and popped to 1.1038 after today’s US data. The prospect of lower US rates is supporting the single currency. Traders ignored regional Euro area data.
GBPUSD traded in a 1.2672-1.2744 band and dismissed UK Q3 GDP data. British economic growth shrank by 0.1% q/q sparking renewed chatter that the country was in a recession. Traders ignored the talk and better than expected Retail Sales in November supported prices.
USDJPY traded in a 141.87-142.55 range and retested the overnight low following today’s data. The minutes from the BoJ October meeting were ignored as they are considered stale.
AUDUSD performed strongly, driven by improved risk sentiment and the RBA’s hawkish stance.
FX high, low, open (as of 6:00 am ET)
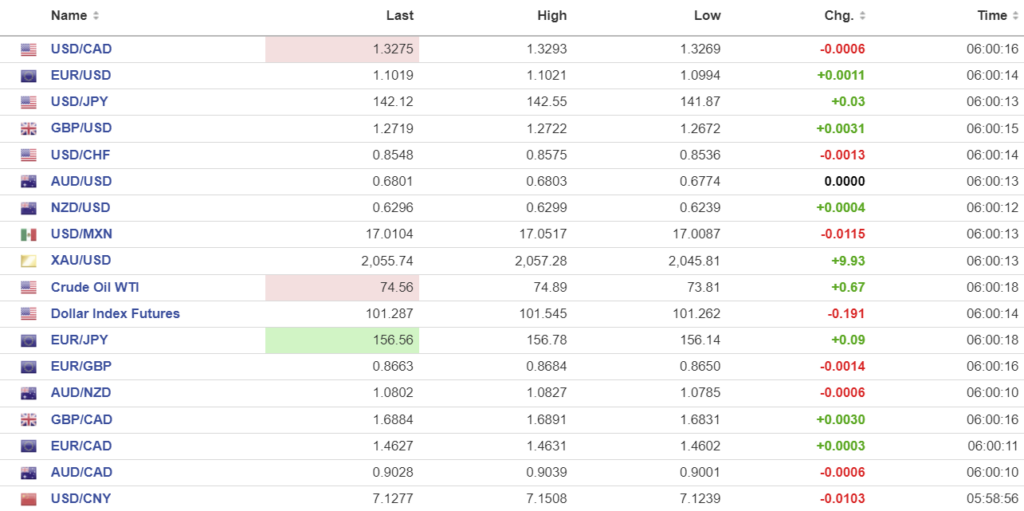
Source: Investing.com
China Snapshot
PBoC fix: today 7.0953, expected 7.1306, previous 7.1012
Shanghai Shenzhen CSI 300 rose 0.19% to 3327.23.
Hong Kong’s Hang Seng index plunges under the weight of new, heavy handed gaming rules, falling 1.89%. A Bloomberg story describes the regulations as vague, all-encompassing, and confusing.
Chart: USDCNY and USDCNH 1-year
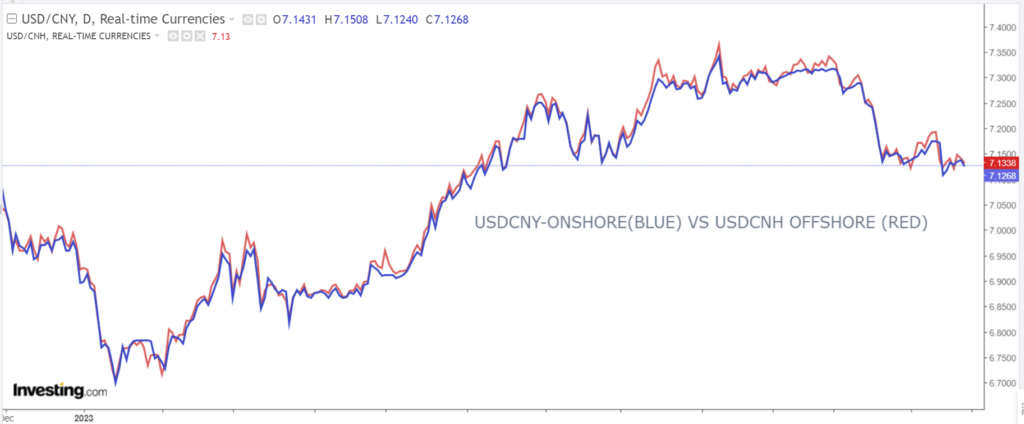
Source: Investing.com