
Photo: Bing AI
October 23, 2023
- US !0-year Treasury yield tops 5.0%.
- Israel/Gaza simmers but does not explode.
- US dollar remains bid but opens mixed compared to Friday’s close.
FX at a Glance
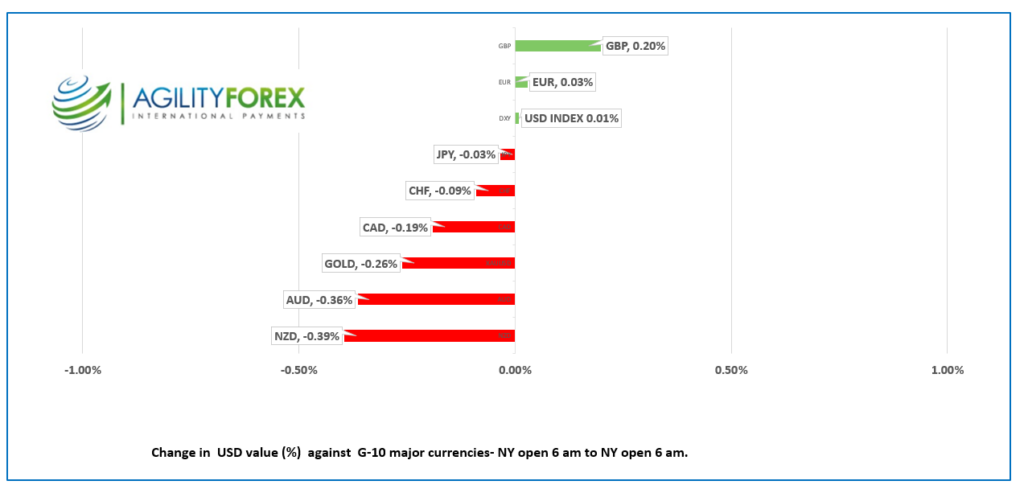
Source: IFXA/RP
USDCAD Snapshot: open: 1.3720-24, overnight range 1.3692-1.3736, close 1.3719
“USDCAD traded sideways but with a bid overnight, with prices following broad US dollar moves. Safe-haven demand for US dollars, combined with steadily rising US Treasury yields, underpinned USDCAD.
The gains were further supported by widening interest rate differentials between Canada and the US. The 10-year spread widened to 87.4 in favor of the US overnight.
WTI oil prices were choppy in an $86.84-$88.23/b range, with the risk of lower demand from slowing global growth offset by concerns about supply disruptions from the Middle East.
The Bank of Canada meets Wednesday and is expected to leave rates unchanged.
USDCAD Technicals
The USDCAD technicals are bullish. The uptrend that began at the end of September with the break above 1.3510 is intact while prices are above 1.3630 and looking for a break of 1.3780 to target the 1.4100 area.
Longer term, the USDCAD covid range is 1.2020-1.4655. Fibonacci retracement analysis of that range on a weekly chart suggests that the break above 1.3650 (61.8% Fibo level) will lead to a test of the 78.6% level at 1.4095.
For today, USDCAD support is at 1.3705 and 1.3670. Resistance is at 1.3750 and 1.3790. Todays Range 1.3670-1.3770.
Chart: USDCAD weekly
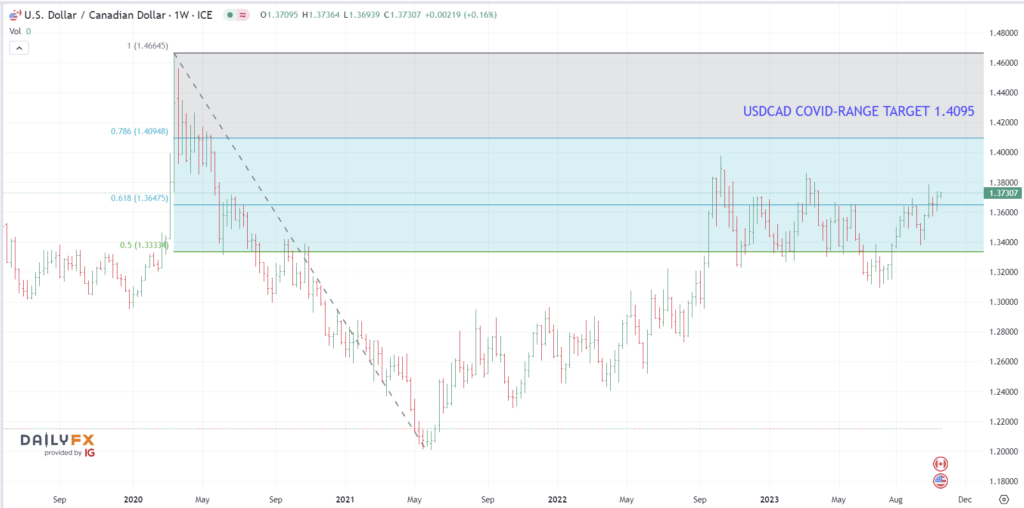
Source: Daily FX
G-10 FX recap
Politicians managed to keep the lid on the explosive situation in Gaza. China sent six warships to the Middle East in a show of support for anything that is anti-USA. Even so, risk sentiment improved slightly as Israel showed restraint by delaying a ground invasion into Gaza and allowing humanitarian aid to flow, knowing full well that Hamas will claim “first dibs.” However, they increased airstrikes.
Global markets started quietly, but traders were skittish ahead of this week’s ECB meeting (Thursday) and the release of a Fed-favorite metric, the Core-PCE price index on Friday.
The US 10-year Treasury yield is trading at 5.02% in early NY, a twenty-six-year peak, and that is keeping equity traders on the defensive. Asian equity indexes closed deep in the red. Japan’s Nikkei 225 index and Australia’s ASX 200 dropped 0.83% and 0.82%, respectively. European bourses are worse for wear. The German Dax is down 1.01%, and the UK FTSE 100 has lost 0.74%.
Fed policymakers did not do anything to provide clarity on the interest rate outlook. Dallas Fed President Lorie Logan and Cleveland Fed boss Loretta Mester see the need for another rate hike, while the Philadelphia Fed’s Patrick Harker and Atlanta Fed President Raphael Bostic think rates should remain unchanged.
EURUSD traded in a 1.0572-1.0616 range with Thursday’s ECB monetary policy meeting in focus. Traders expect that the upcoming Eurozone PMI data and German IFO data will support a decision to leave interest rates unchanged. EURUSD technicals are bearish below 1.0650 with minor support at 1.0530.
GBPUSD drifted in a 1.2143-1.2185 range with prices continuing to be weighed down by weak retail sales and producer prices data on Friday. Traders are hoping Tuesday’s UK employment report will provide fresh direction. GBPUSD is modestly bid but below the July downtrend line at 1.2300.
USDJPY traded narrowly in a 149.78-150.00 range due to the rise in the US Treasury yield above 5.0%. There is speculation that the rising treasury yields will force the Bank of Japan to tweak the yield curve control (YCC) bands at its next meeting.
AUDUSD traded with a negative bias in a 0.6289-0.6323 range due to concerns about lower Chinese demand in the face of geopolitical tensions. New Zealand markets were closed today.
The Chicago Fed National Activity Index is the only US economic data released today.
FX high, low, open
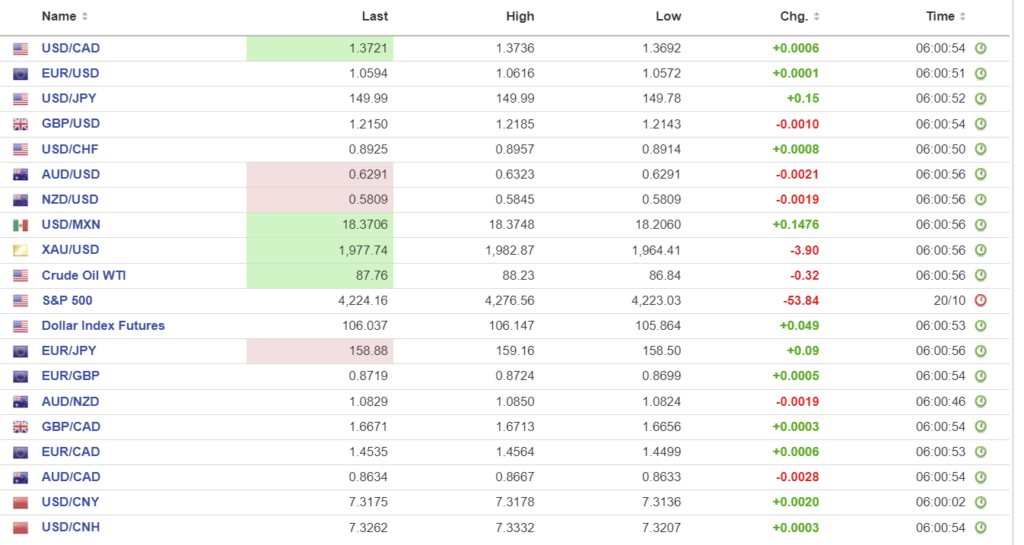
Source: Investing.com
China Snapshot
PBoC fix: today 7.1792, expected 7.3109, previous 7.1793.
Shanghai Shenzhen CSI 300 fell 1.04% to 3474.24.
Chart: USDCNY (onshore) vs USDCNH (offshore)
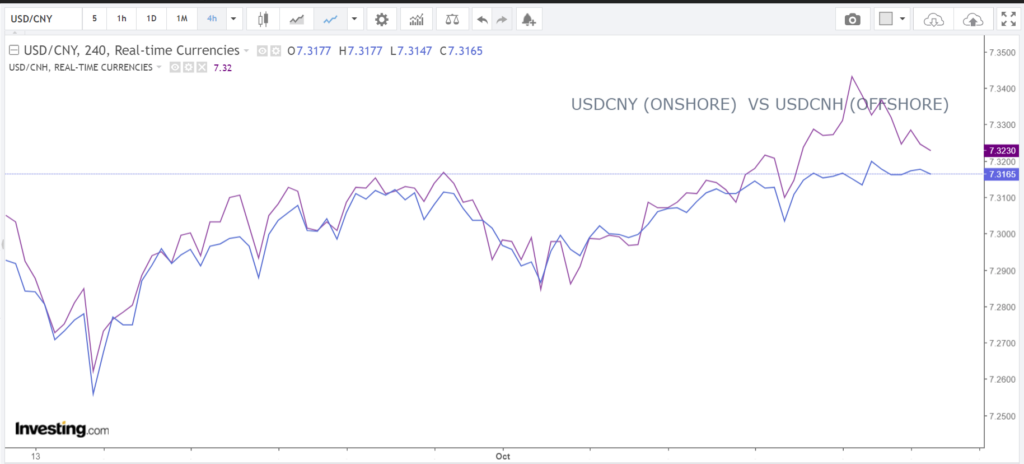
Source: Investing.com