
March 1, 2023
- China PMI data surges, boosting global recovery theme.
- Fear of underestimating peak Fed rates curbs enthusiasm.
- US dollar opens mixed-CAD and GBP underperform.
FX at a glance-
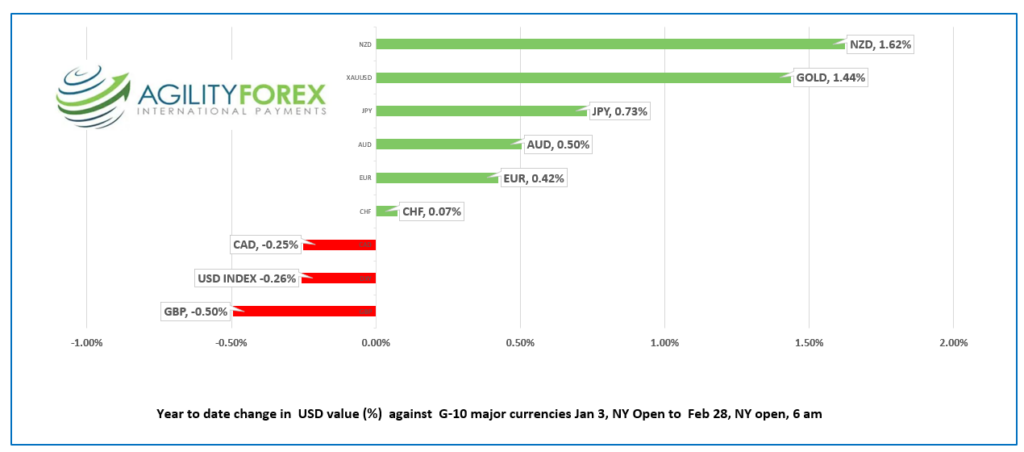
Source: IFXA Ltd/RP
USDCAD Snapshot: open 1.3597-01, overnight range 1.3586-1.3657, close 1.3646
USDCAD dropped steadily, falling from the 1.3657 resistance area to 1.3593 just before NY opened. The price action is tracking S&P 500 futures moves while garnering a modicum of support from steady oil prices.
USDCAD saw a little support from the weaker than expected Q4 GDP report yesterday. The Canadian economy was flat 0.0% in Q4 which was well-below the forecast for a 1.5% increase. The result will tell BoC Governor Tiff Macklem that he was right to announce a pause in rate hikes.
The BoC is widely expected to leave rates unchanged at the March 8 meeting, while the FOMC is expected to hike rates 25-50 bps on March 22.
WTI oil prices are bouncing between $76.16-$77.71 with the robust Chinese PMI data offsetting disappointment after the API reported US crude inventories rose 6.2 million barrels last week, which is on top of the nearly 10 million barrel increase the week before.
Traders are content to buy USDCAD around 1.3560 and sell around 1.3660, at least until March 8.
USDCAD Technical Outlook
USDCAD intraday technicals continue to flip between bearish and bullish all the while trapped in a 1.3250-1.3700 range which has contained price action since the start of the year. That won’t change today.
USDCAD is in a mild uptrend while above 1.3560 with a break above 1.3660 extending gains to the 1.3660-80 area. A break below 1.3560 will lead to a test of support at 1.3510, then 1.3460.
For today, USDCAD support is at 1.3560 and 1.3510. Resistance is at 1.3630 and 1.3680.
Today’s range 1.3560-1.3660
Chart: USDCAD 4 hour
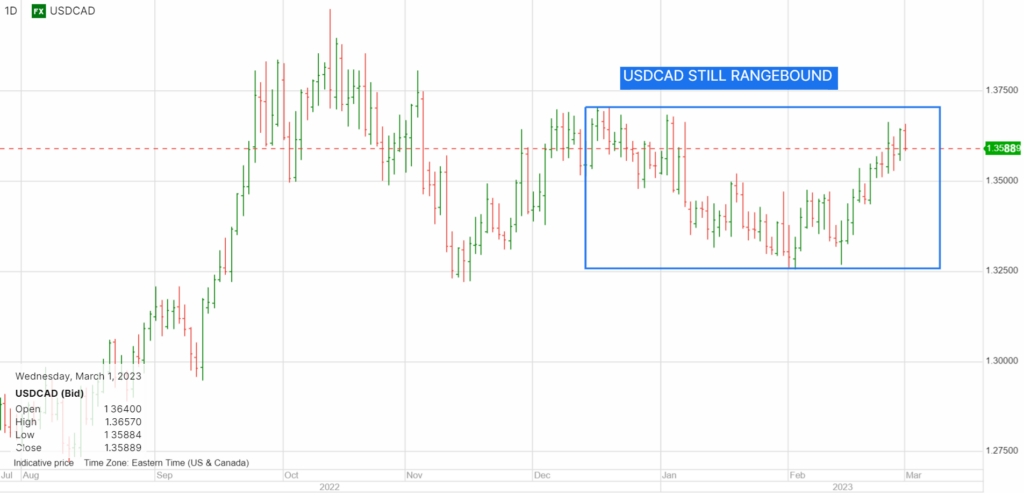
Source: Saxo Bank
G-10 FX recap and outlook
The surprisingly robust Chinese PMI data improved global risk sentiment, albeit tepidly, helping traders forget about yesterday’s disappointing US consumer confidence data (actual 102.9 vs 106.0 in January).
The US dollar traded defensively overnight as Asian equity indexes clawed out gains. The Australian ASX 200 index close around flat. European bourses are higher led by a 0.91% gain in the UK FTSE 100 index.
S&P 500 futures flipped from a gain to a small loss despite the US 10-year Treasury yield slipping to 3.916% from 3.953%. Gold traders liked the improved risk tone and lifted XAUUSD to $1836.77 from $1826.99 at Tuesday’s close.
EURUSD climbed steadily in a 1.0566-1.0691 range. Prices are at the top of the band in early NY, after German HICP inflation rose 9.3% y/y rather than the 9.2% forecast. Improved risk sentiment following the Chinese PMI report, and hawkish comments from ECB officials have EURUSD targeting 1.0880 on a break of 1.0710.
GBPUSD consolidated yesterdays’ gains in a 1.2015-1.2088 range. UK Manufacturing PMI ticked higher, from 49.2 to 49.3. Bank of England Governor Andrew Bailey reiterated that future rate moves are data dependent, which is supposed to pass as meaningful insight.
USDJPY traded in a 135.27-136.46 and is at the bottom of that band due to US 10-year Treasury yields falling from the overnight peak.
AUDUSD dipped to 0.6697 in the wake of disappointing Q4 GDP results, then rallied non-stop to 0.6777 just before NY opened. Q4 GDP rose 0.5% q/q which was below the forecast of a 0.8% q/q increase. The disappointment was forgotten when January CPI was lower than expected at 7.4% y/y (forecast 8.0%, December 8.4% y/y). The surge in Chinese PMI data also underpinned the currency.
FX open, high, low, previous close as of 6:00 am ET
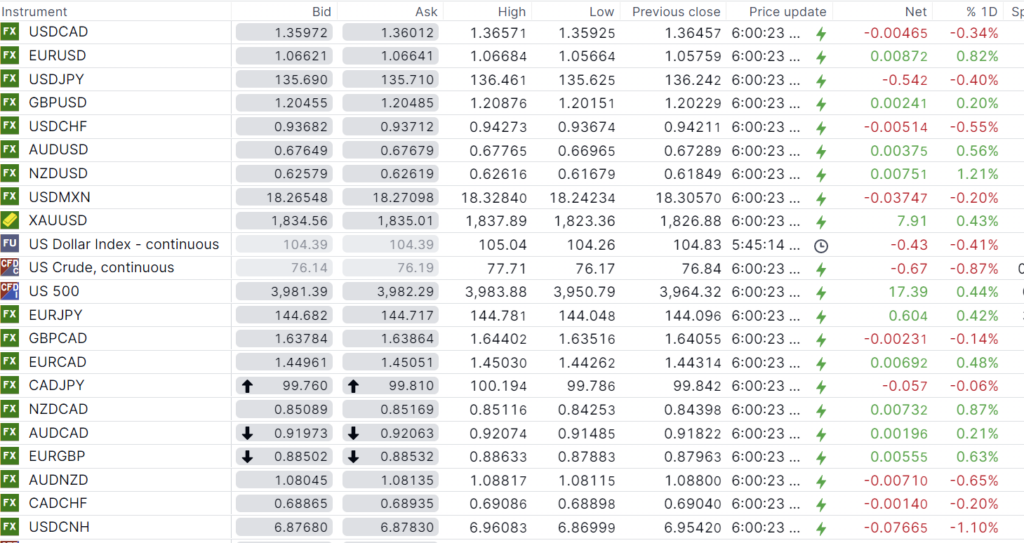
Source: Saxo Bank
China Snapshot
Bank of China Fix: 6.9400, Previous: 6.9519
Shanghai Shenzhen CSI 300 rose 1.41% to 4126.94.
NBS February Manufacturing PMI 56.3 (forecast 50.5, January 50.1), Non-manufacturing PMI 56.3 (forecast 49.7, January 56.4)
Caixin Feb Manufacturing PMI 51.6 (forecast 50.2, previous 49.2)
PMI data suggest China’s economic rebound, post-Covid-zero is getting legs.
Chart: USDCNY 1 month
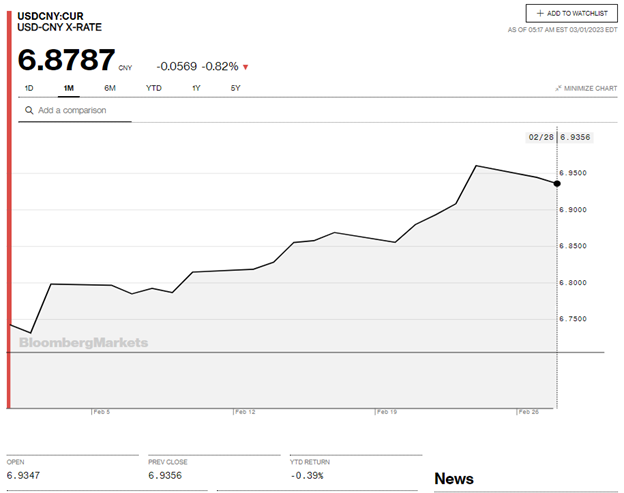
Source: Bloomberg