
Source: HDclipartall.com
- Talk of inter-meeting Fed rate hike underpins Treasury yields
- Fed’s Bullard favours 1.00% hike by July 1
- US dollar hangs on to post-CPI gains
FX at a Glance
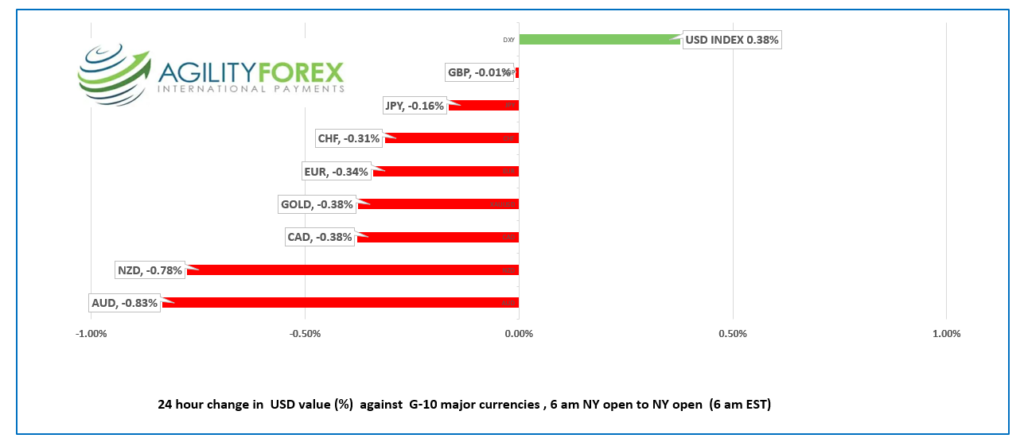
Source: IFXA Ltd/RP
USDCAD Snapshot: Open 1.2726-30, Overnight Range-1.2696-1.2752, previous close 1.2721
USDCAD found a bottom at 1.2640 yesterday then exploded higher following a hawkish interest rate outlook by St Louis Fed President James Bullard. The rally stalled at the 1.2750 resistance area, partly due to WTI oil prices rising above $91.00/barrel in NY.
USDCAD price action will get very messy between 1.2650 and 1.2690 as there are around $8.0 billion of strikes maturing ahead of the 10:00 am option expiry window.
USDCAD downside is also limited to concerns that if the ongoing border disruptions continue, it will raise inflation, reduce economic growth, and boost unemployment.
Technical view: USDCAD tested support and resistance in the past 24 hours and both sides held. That won’t change today. The hourly uptrend line from January 20 is intact, while the long-term downtrend from June 2020 contains rallies while prices are below 1.2830.
For today, USDCAD support is at 1.2670 and 1.2640. Resistance is at 1.2750 and 1.2790. Today’s Range 1.2670-1.2750
Chart USDCAD 4 hour
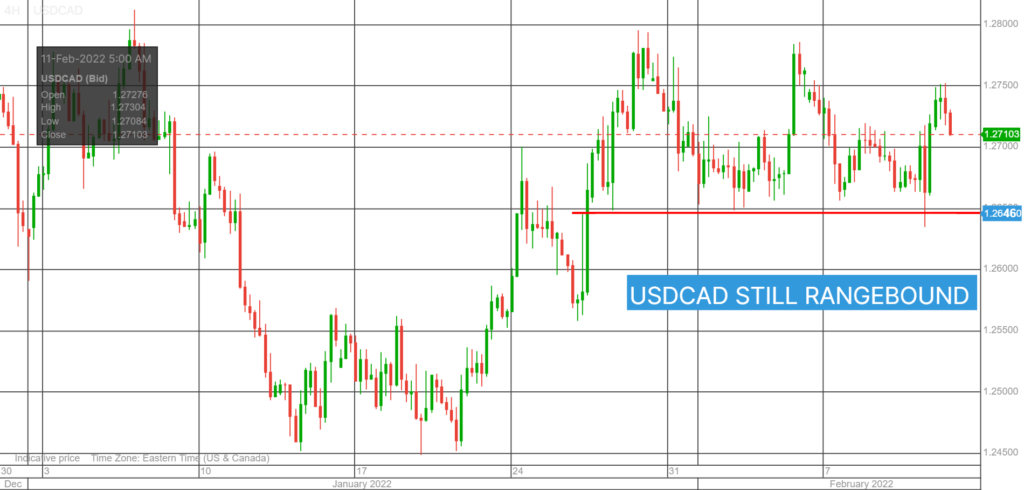
Source: Saxo Bank
G-10 FX recap and outlook
Fed rate hike fever threatens to become financial market equivalent of the Omicron variant; harsh for some, less so for others.
St Louis Fed President and FOMC voting member is chirping about the need for a 100 basis point increase in rates by July 1. If he gets his way, one of the next three FOMC meetings will come with a 0.50% hike. That meeting is March 16, according to the CME FedWatch tool, which has an 87% probability priced in.
There is even speculation of an inter-meeting rate hike at the closed door Fed board meeting on February 14. That idea was refuted in a Bloomberg article that said such a move would suggest the Fed was behind the curve.
In Asia, the Nikkei 225 rose 0.42%, while the rest of the major indexes closed with losses. European bourses are underwater. S&P 500 and DJIA futures are in negative territory but off their worst levels. Oil is at the top of its overnight range while gold prices slipped. The US 10 year Treasury yield dipped from 2.032% to 2.006%
EURUSD traded with a negative bias in a 1.1371-1.1429 range. Dovish comments by ECB President Christine Lagarde contrasted with the latest Fed rate hike speculation and weighed on EURUSD. Ms Lagarde said that raising rates would not solve the current problems and that inflation would fall during the year. Even so, the EURUSD technicals are bullish above 1.1330.
GBPUSD is recovering after yesterday’s plunge from 1.3640 to 1.3514 in Asia overnight. Prices rallied to 1.3569 following robust UK data. UK GDP grew by 1.0% q/q in Q4 2021 (following a downwardly revised 1% in Q3). Overall, the economy grew by 7.5% for 2021 (from -9.4% in 2020) and by Q4, GDP was 0.4% below its pre-pandemic level in Q4 2019. GBPUSD technicals are bullish above 1.3510.
USDJPY retreated from yesterday’s 116.32 peak that followed the US CPI print of 7.5% y/y and the US 10-year Treasury yield touching 2.057%. In addition, the BoJ plan to issue unlimited 0.25% JGB’s for YCC reasons is underpinning prices.
AUDUSD peaked at 0.7243 yesterday, post-CPI, then plunged to 0.7110 overnight, before rising to 0.7138 in NY. RBA Governor Philip Lowe helped sink the currency when he said the bank is prepared to be patient and that they have the scope to wait and assess the data.
NZDUSD mirrored AUDUSD moves, rising from 0.6629 to 0.6675 overnight. Prices were supported by the RBNZ quarterly inflation expectations report rising to 3.27% from 2.96% previously.
The Michigan Consumer Sentiment Report is expected at 67.5.
Chart of the Day: USDCAD (blue) SP500 5 minute, 2 day chart
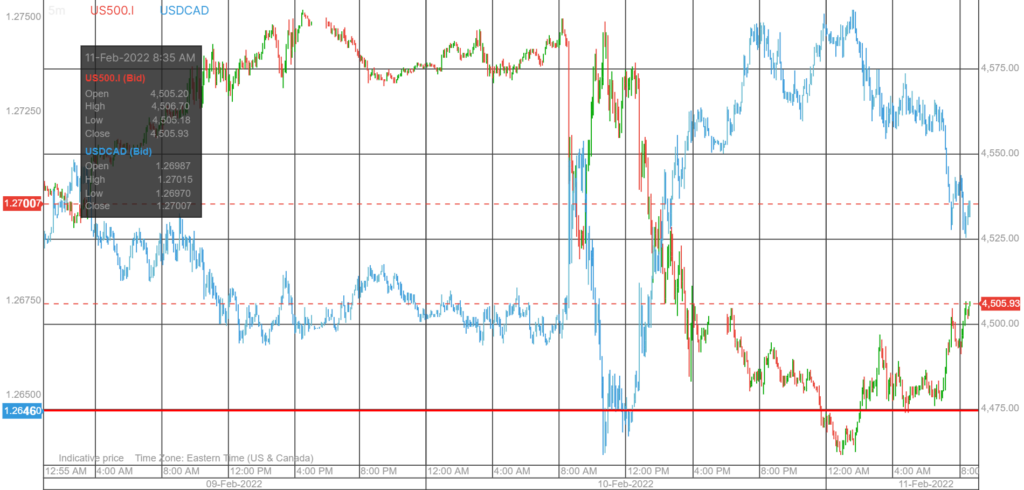
Source: Saxo Bank
FX open, high, low, previous close as of 6:00 am ET
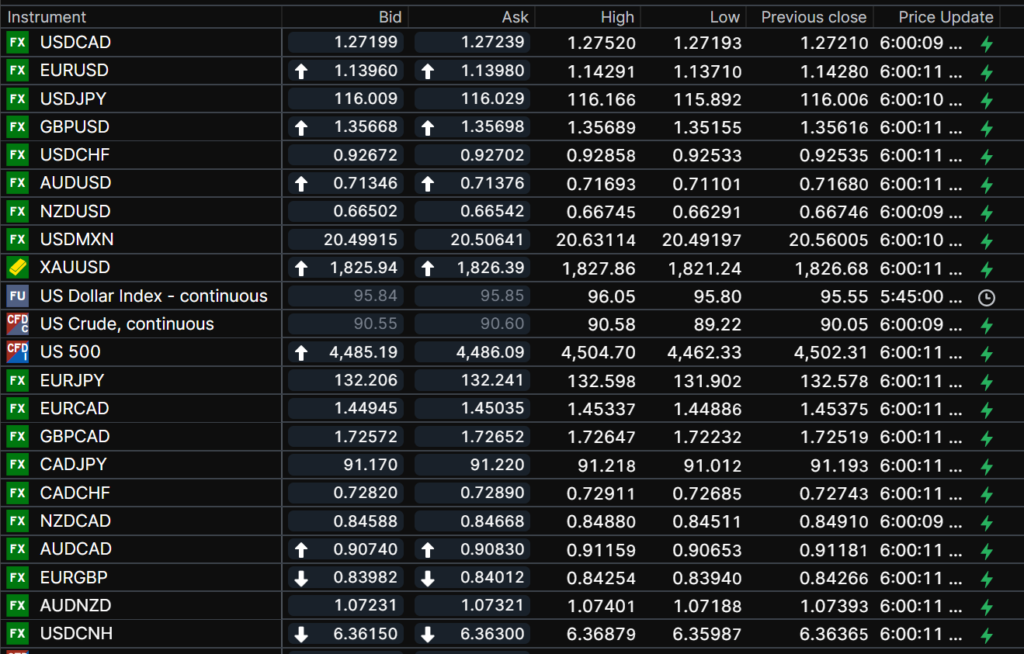
Chart: Saxo Bank
China Snapshot
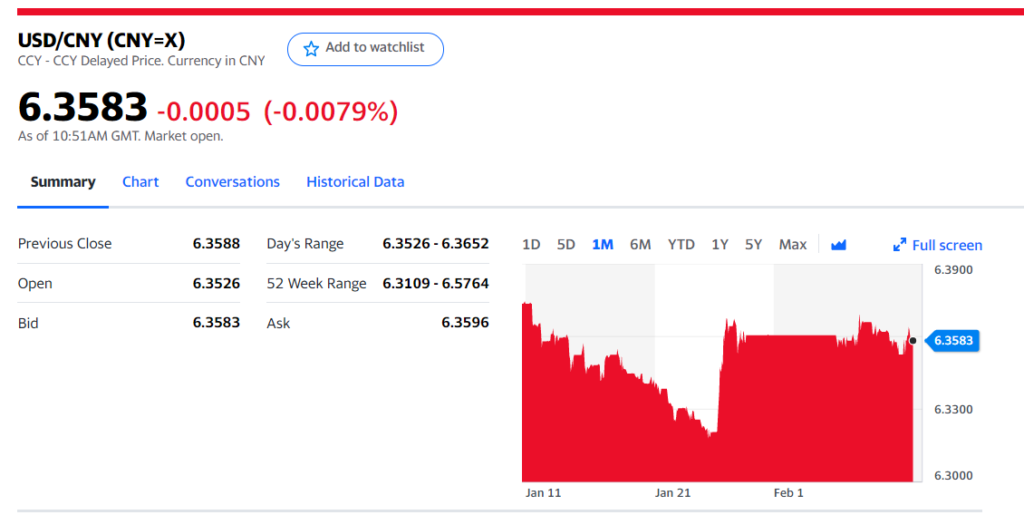
Today’s Bank of China Fix 6.3681, previous 6.3599
Shanghai Shenzhen CSI 300 fell 0.83% to 4601.39
Chart: USDCNY one month
Source: Saxo Bank