
July 30, 2024
- Eurozone GDP rises while German GDP falls.
- Firmer equity indexes improve FX risk sentiment.
- US dollar trading sideways after quiet overnight session expect for JPY.
FX at a Glance
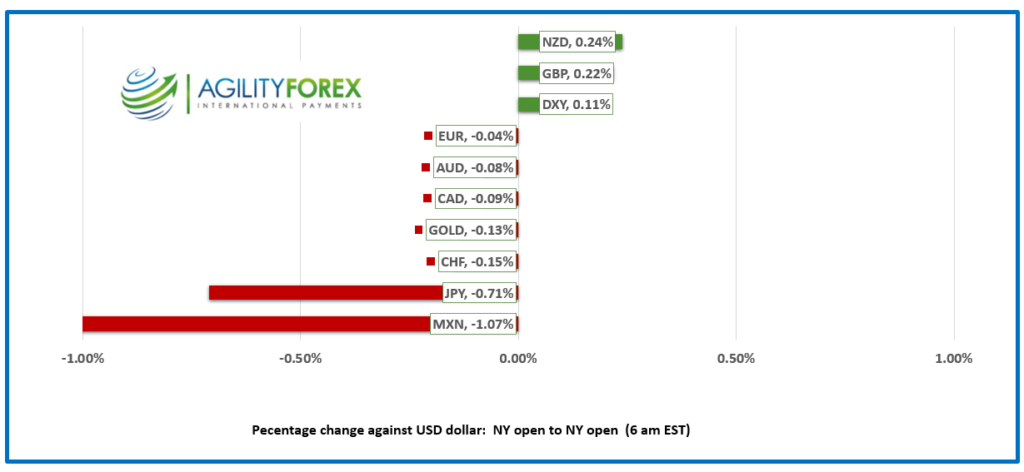
Source: IFXA/RP
USDCAD open 1.3843, overnight range 1.3838-1.3864, previous close 1.3855
USDCAD trades sideways but a tad softer in an uneventful overnight session. The count down to the FOMC statement has dampened enthusiasm for getting involved which is exacerbated by thin, sweltering summer markets.
The CAD/US 10-year yield spread has widened to -87 bps in favour of the US while the 2-year spread also widened (to -58.1)which should limit USDCAD downside.
WTI oil prices are lower and trading in a 75.33-75.97 range. Ongoing concerns about Chinese crude demand and fears of an oil glut in Q4 2024 are driving prices lower, especially after Israel has shown restraint and hasn’t retaliated against Lebanon.
There are no Canadian economic releases today.
USDCAD Technicals
The intraday USDCAD technical unchanged as prices consolidate recent gains below key resistance in the 1.3860 area. The 2-week long USDCAD uptrend channel is guiding prices higher inside a 1.3790-1.3890 channel.
Longer term, the break of resistance in the 1.3780-90 area has set the stage for a test of 1.3890, which if broken, puts the Covid-peak of 1.4660 in play.
For today, USDCAD support is at 1.3820 and 1.3790. Resistance is at 1.3880 and 1.3910. Today’s Range 1.3820-1.3890.
Chart: USDCAD 4 hour
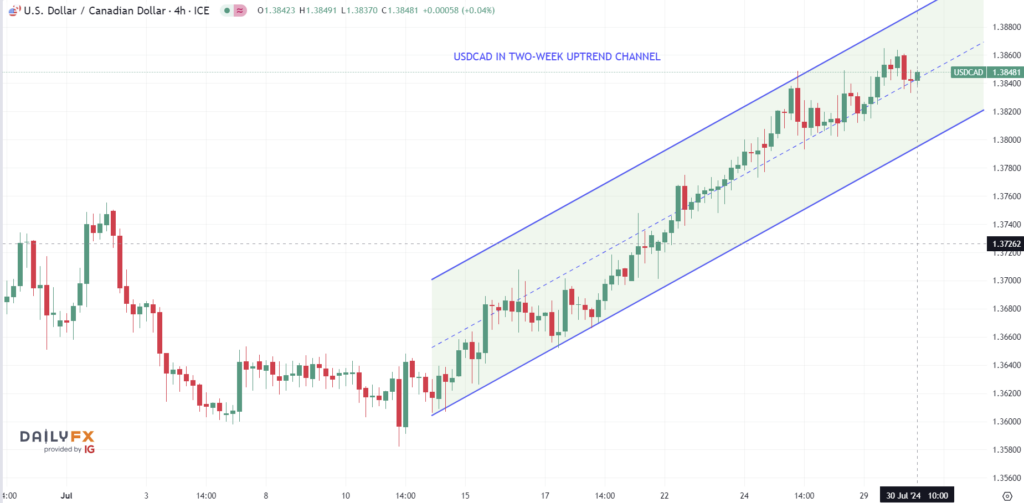
Source: DailyFX
Seine is Full of Crepe
The Paris Olympics had to cancel a men’s triathlon training session because the Seine was dangerously polluted. When Paris gets hit with torrential rainstorms, toilets flush directly into the river. The same issue occurs in Toronto after heavy rain, causing extremely high levels of E.coli in the water at all Toronto’s beaches. Eau de toilette is now the essence of Toronto swimmers.
JOLTS Won’t Jolt Markets
The Job Openings and Labor Turnover Survey (JOLTS) is expected to show job openings declining to 8.03 million from 8.14 million last month. The Case-Shiller Home Price Index is anticipated to show a 6.6% year-over-year increase compared to 7.2% previously. Consumer Confidence data is also on tap. Better-than-expected results may reinforce September rate cut expectations, which are already at 94%.
EURUSD
EURUSD traded in a 1.0814-1.0835 range and is at the top of the band after higher-than-expected Q2 Eurozone GDP (actual 0.3% vs forecast 0.2%). Gains were tempered by disappointing German GDP data, as the German economy shrank by 0.1% quarter-over-quarter in Q2 (forecast 0.2%). Even so, traders are marking time until the FOMC decision is announced.
GBPUSD
GBPUSD drifted higher in a 1.2843-1.2866 range with price action mirroring EURUSD moves. Bloomberg consensus is that the Bank of England will trim rates by 25 basis points.
USDJPY
USDJPY moved erratically in a 153.62-155.22 range ahead of Thursday’s Bank of Japan meeting. The market is undecided as to whether the BoJ will raise rates by 15 basis points or maintain its cautious approach.
AUDUSD and NZDUSD
AUDUSD drifted in a 0.6533-0.6562 range with Australian inflation data to be released tomorrow. If inflation ticks higher as expected, it raises the odds that the RBA could raise rates at its August 6 meeting. NZDUSD inched higher in a 0.5864-0.5901 range due to modestly improved risk sentiment, although gains are limited by ongoing growth issues in China.
USDMXN
USDMXN traded sideways in an 18.5752-18.7180 range, consolidating its losses after yesterday’s trade data showed Mexico’s trade deficit widened to its worst level since August 2020.
Bitcoin (BTCUSD)
BTCUSD fell from 70,162 to 66,003 after the US government moved $2.0 billion of seized tokens to an undisclosed address and then started to unload them. The risk of further sales will limit gains in the near term.
FX high, low, open (as of 6:00 am ET)
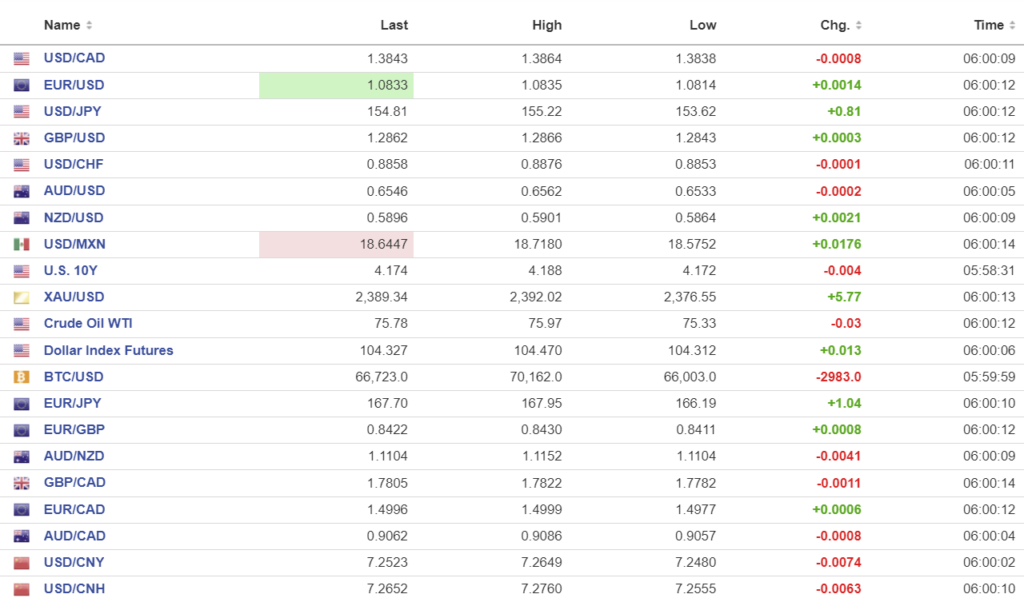
Source: Investing.com
China Snapshot
PBoC fix: 7.1364 vs exp. 7.2586 (prev. 7.1316).
Shanghai Shenzhen CSI 300 fell 0.54% to 3390.74.
Chart: USDCNY and USDCNH
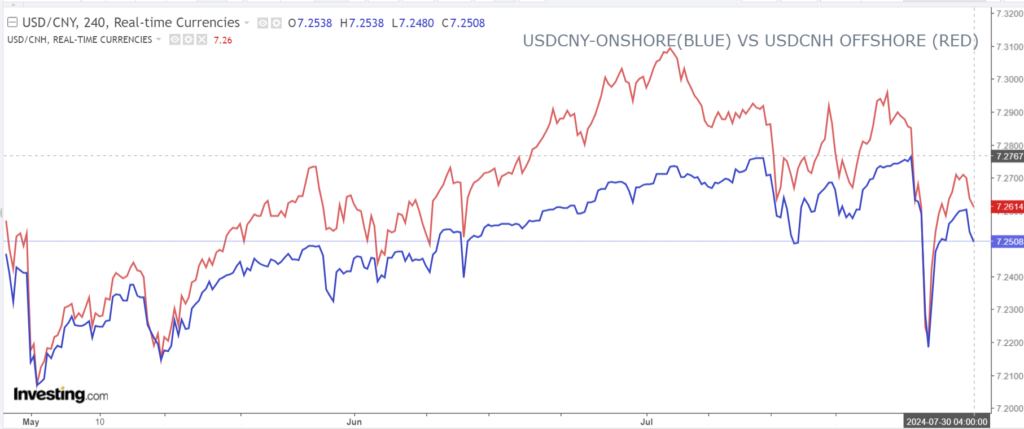
Source: Investing.com