April 15, 2026
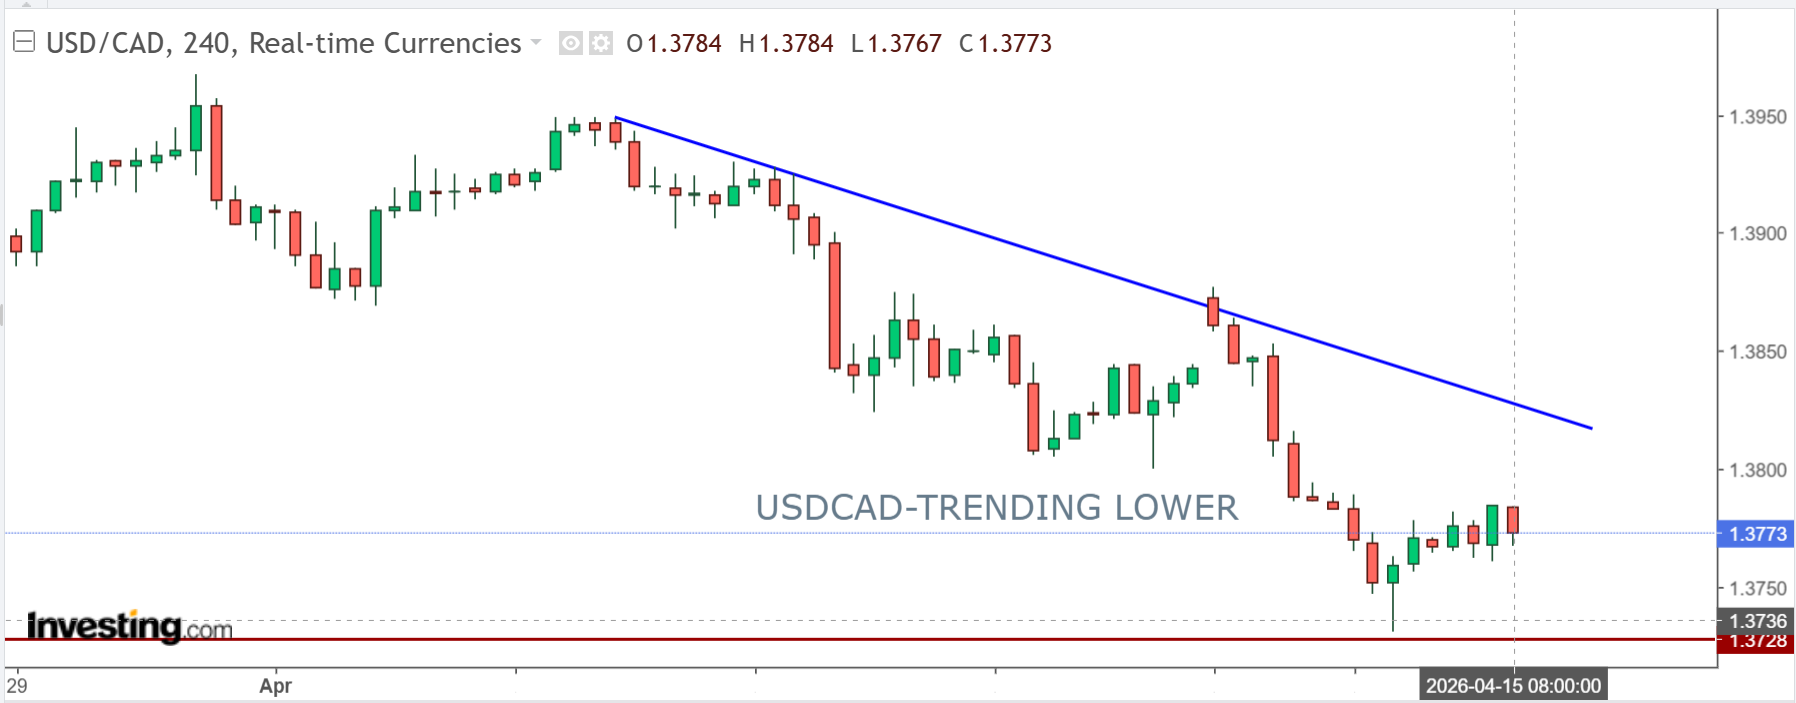
USDCAD open: 1.3774, overnight range 1.3761-1.378, close 1.3768
USDCAD is trading sideways but with a bearish bias as traders evaluate the latest developments in the US and Iran conflict. Trumps comments yesterday suggesting that the end of the war was in sight knocked oil prices lower, boost stocks and weighed on the US dollar index. The Canadian dollar went along for the ride.
Canadian consumers can breathe a sigh of relief after Prime Minister Mark Carney announced his government was “temporarily suspending the federal Fuel Excise Tax on gasoline and diesel” fuel until Labour Day. Consumers will save 10 cents/liter on gas meaning they can afford a medium sized coffee at Tim Hortons after purchasing 200 liters of fuel.
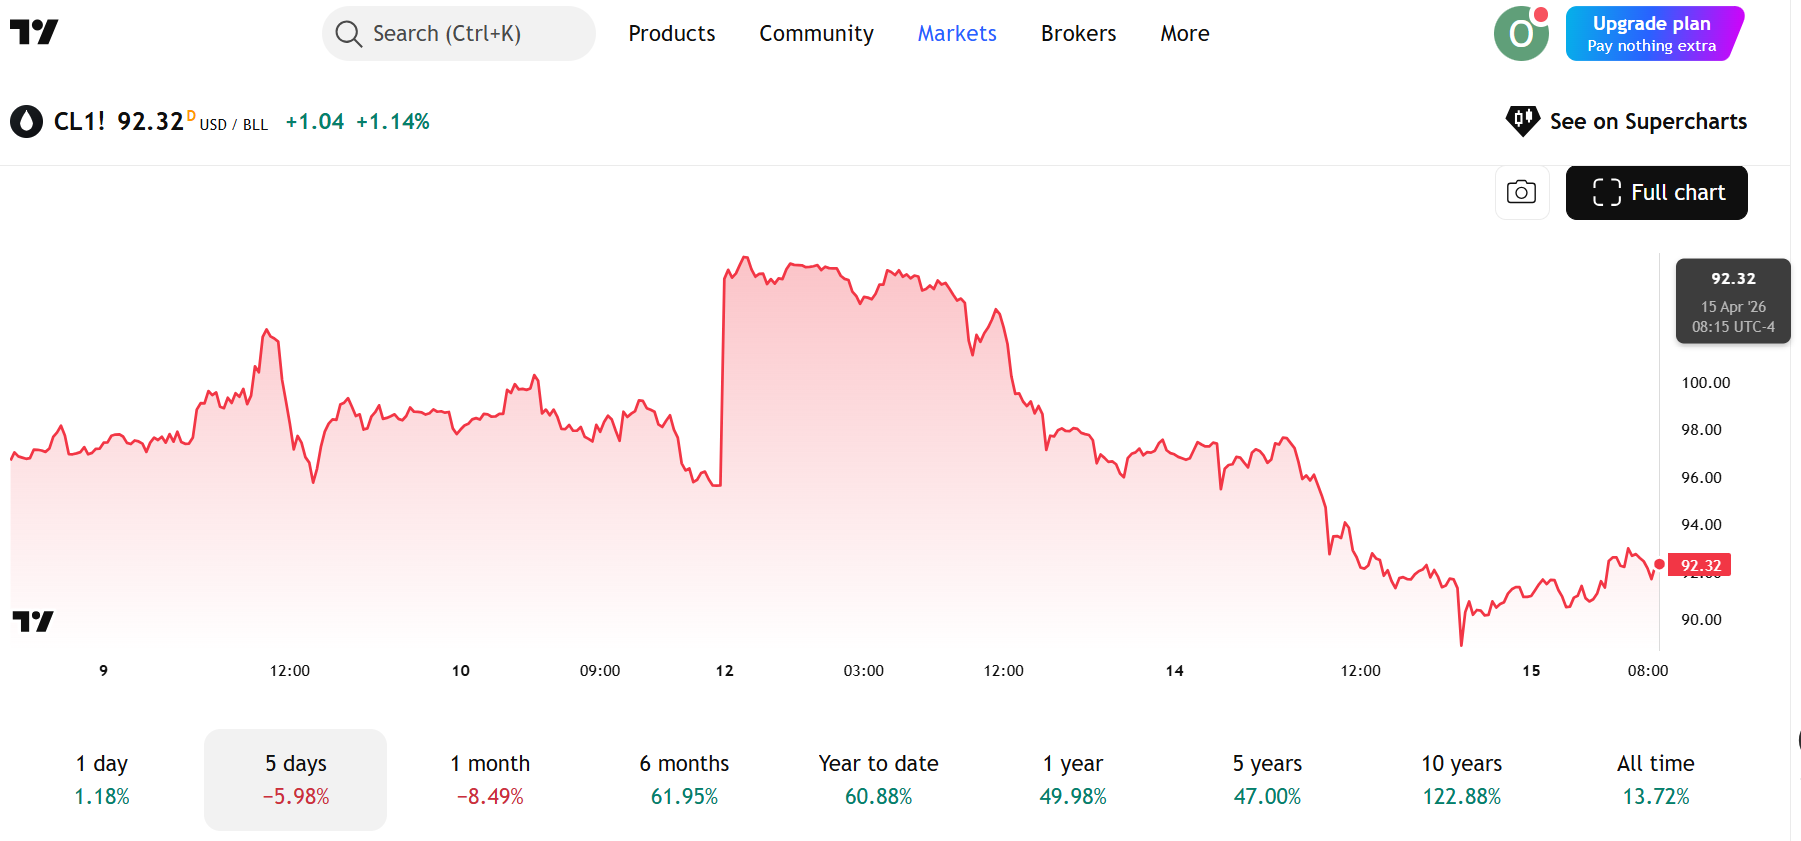
WTI oil prices dropped to 87.08 in Asia then bounced to 93.27 before settling in at 92.32 in NY trading. WTI has dropped $5.44 in the past five days which has sparked broad -based US dollar selling pressure. Oil traders are banking on hopes for successful US and Iran peace talks. The US waiver on Iranian crude exports expires today.
Canada Manufacturing Sales data fell 3.6% m/m in February and rose 2.0% y/y. The US Export prices index rose 1.6% in March (Previously 1.9% m/m) while Import prices rose 0.8% m/m.
USDCAD Technical Outlook
The intraday USDCAD technicals are bearish below 1.3830 and looking for a break below 1.3730 to target 1.3690. A move above 1.3830 opens the door to 1.3860. The RSI is near 52, suggesting neutral momentum but with a slight downside bias after the recent rejection from the upper band.
The medium-term USDCAD outlook is neutral to bearish following repeated failures ahead of the 1.4000–1.4030 area and the recent rejection from the upper Bollinger Band (1.4029). USDCAD is trading below the 100 and 200-day moving averages at 1.3816–1.3820, which now act as resistance. The lower Bollinger Band at 1.3673 is the next key support, and a decisive break below that level would expose 1.3600.
For today, USDCAD support is at 1.3740 and 1.3710. Resistance is at 1.3790 and 1.3820.
Todays range 1.3740-1.3820
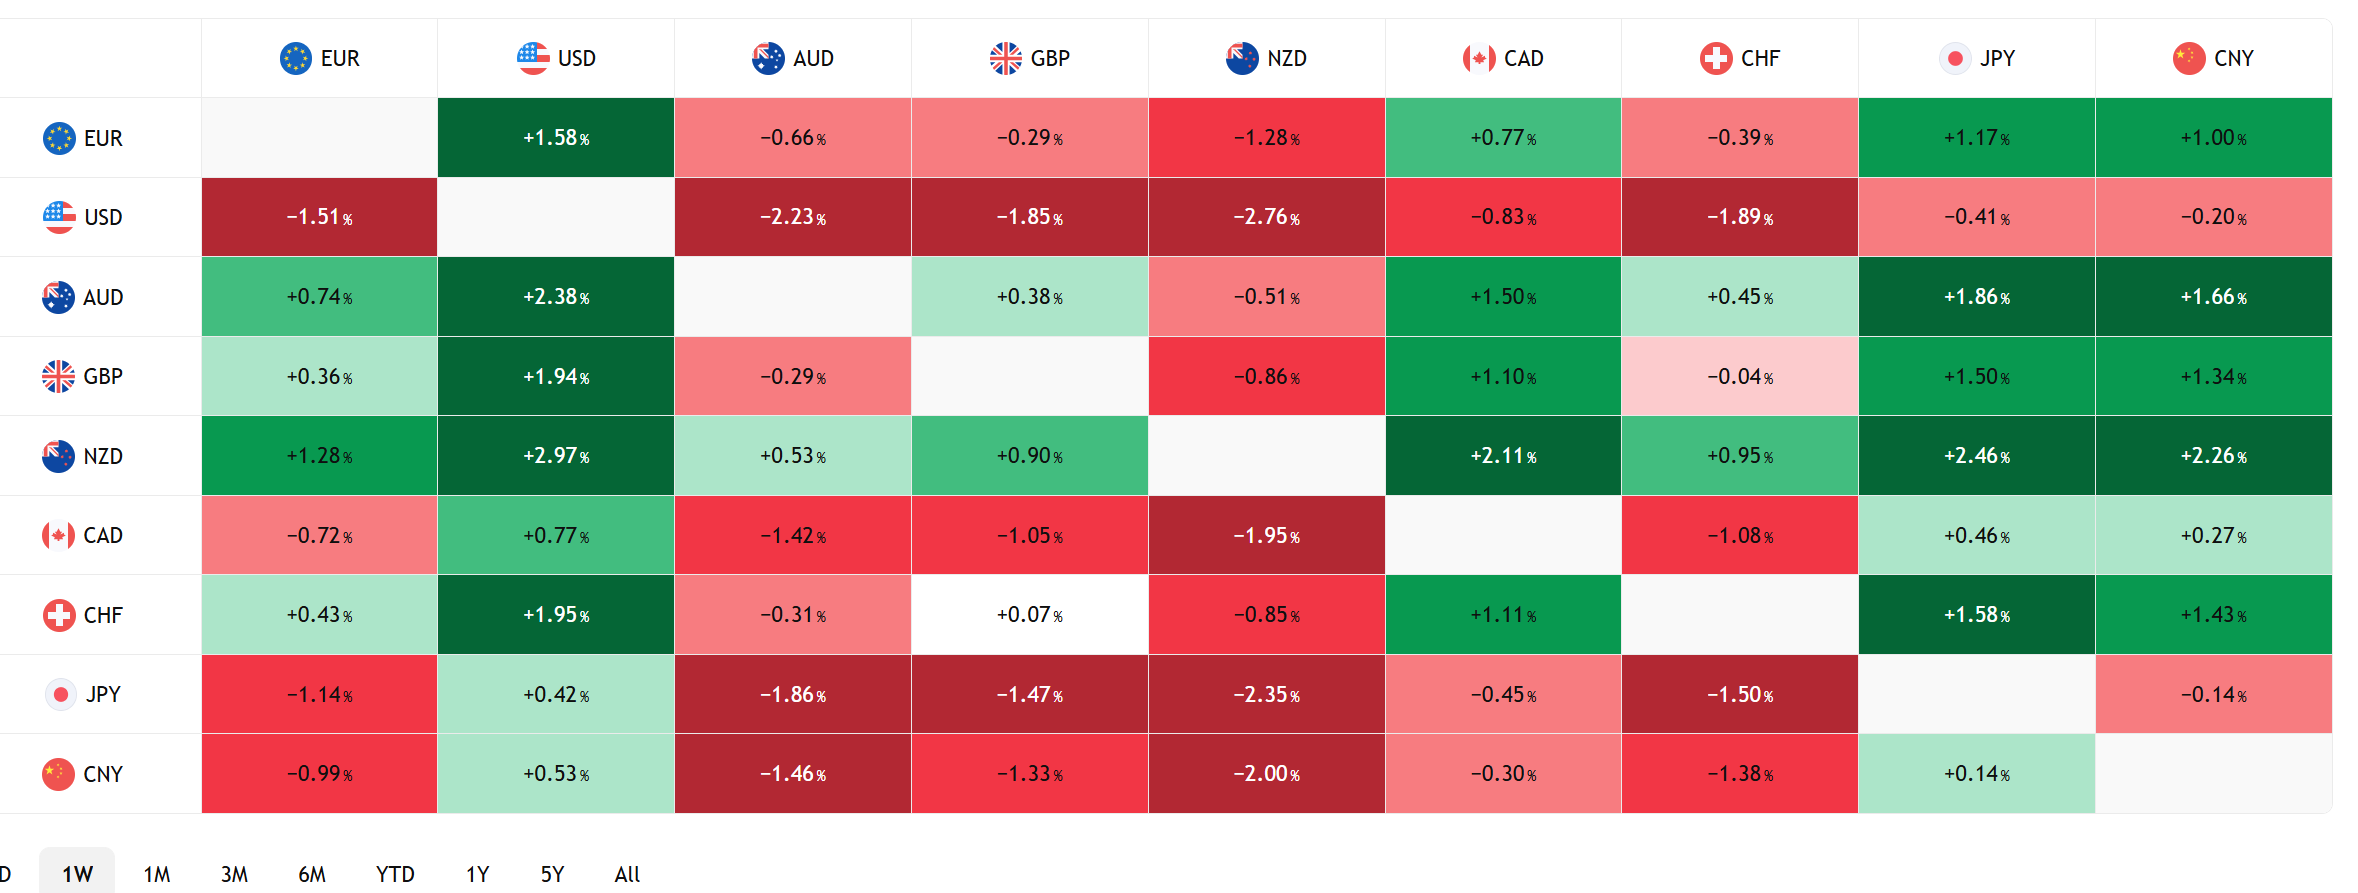
FX Heat Map (6:00 am ET) one week
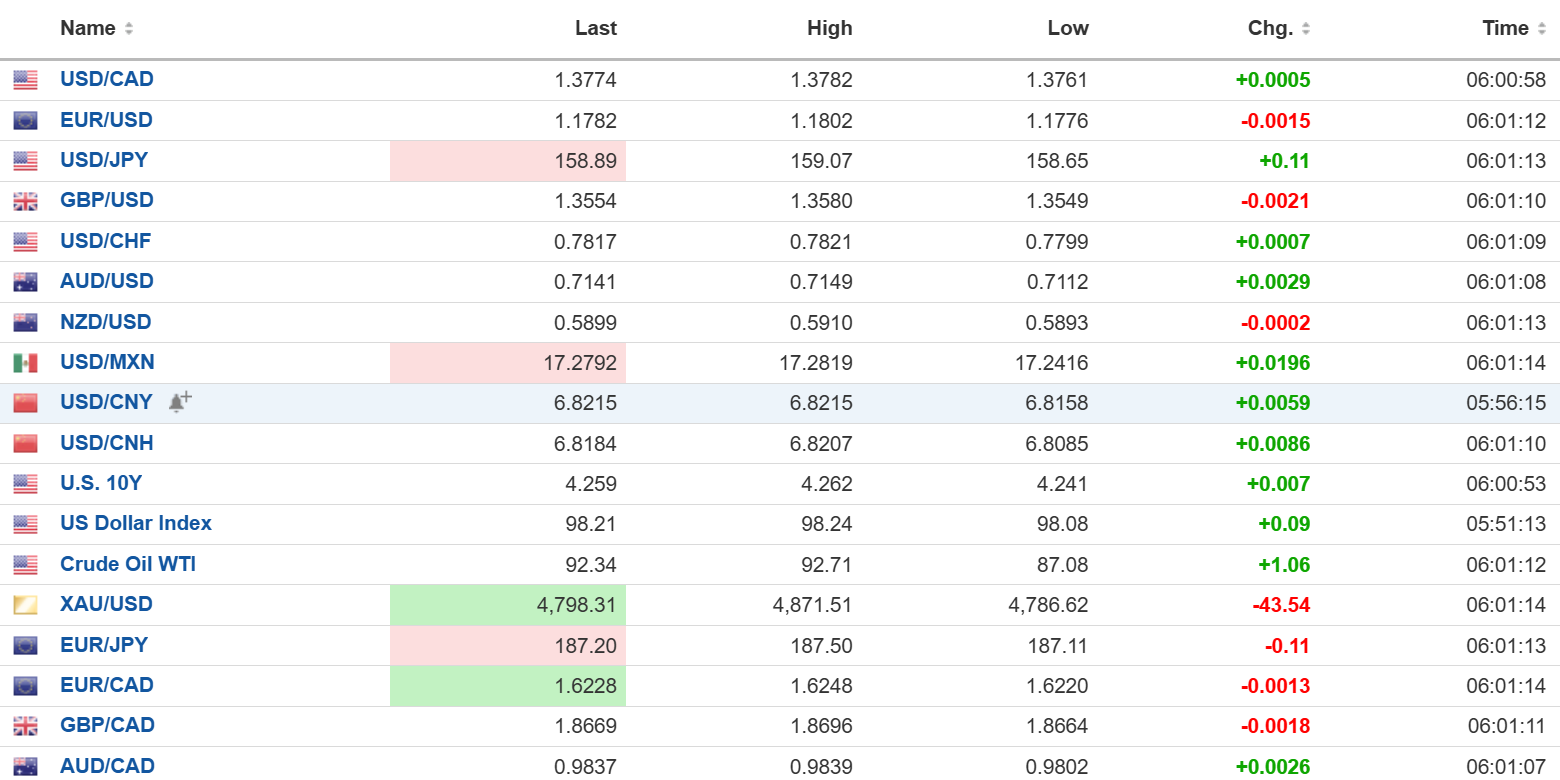
FX open high low 6:00 am ET
Markets Moving On
Trump’s Operation Epic Fury wreaked havoc across financial markets throughout March, but April showers did not just bring May flowers, but also brought the belief that the hostilities are just about done. Traders are bored with the war and, despite Trump’s demonstrated aversion to the truth, have chosen to believe his “just about done” comment.
The S&P 500 has fully recouped all its losses incurred in the wake of Trump’s attack on Iran and is near its record high. The US dollar index has given back most of its post-war gains, and Treasury yields are well below the peak seen in March. Gold prices are rising due to fears that the lingering impact of high oil prices will derail global economic growth.
Taking Stock
Asian equities finished higher, with Japan’s Topix gaining 0.40% and the Hong Kong Hang Seng rising 0.29%. Australia’s ASX 200 closed flat.
As of 5:30 am PT, European bourses are mixed to flat. The German DAX and UK FTSE 100 indices are flat, while the French CAC 40 is down 0.54%. S&P 500 futures are unchanged, the 10-year Treasury yield is 4.268%, the DXY is 98.23, and gold (XAUUSD) is 4,811.47
EURUSD
EURUSD drifted aimlessly in a 1.1772-1.1802 range. Traders wanted to believe that the end of the Iran/US war was near but were unwilling to get too invested in that view. One of the reasons is that, according to ECB President Christine Lagarde, the hostilities have moved the economy closer to the “adverse scenario area.” That scenario assumes sharply higher energy prices, increased uncertainty, and inflation at 3.5%.
GBPUSD
GBPUSD traded sideways in a 1.3544-1.3580 range. Prices were supported by optimism around the end of Trump’s war and hawkish comments from a BoE MPC member warning of rate hikes if energy costs spark wage increases and higher prices for goods and services. Gains were also limited because of the IMF report saying that the UK economy will suffer the most of the G7 economies because of the energy shock. The IMF cut UK growth to 0.8% from January’s forecast of 1.3%.
USDJPY
USDJPY chopped around in a 158.65-159.15 range. The price action mirrored oil price movements, which overshadowed the small decline in US Treasury yields. Japanese machinery orders rose 13.6% m/m and 24.7% y/y in February, well above the forecasts of -1.1% and 8.5%, respectively.
AUDUSD
AUDUSD traded in a 0.7112-0.7149 range, supported by general US dollar softness, lower oil prices, and modest but positive risk sentiment.
USDMXN
USDMXN traded with a bit of a bid in a 17.2416-17.3156 range with a bout of profit-taking providing some support. Price action tracked broad US dollar moves and optimism around more US/Iran peace talks.
China
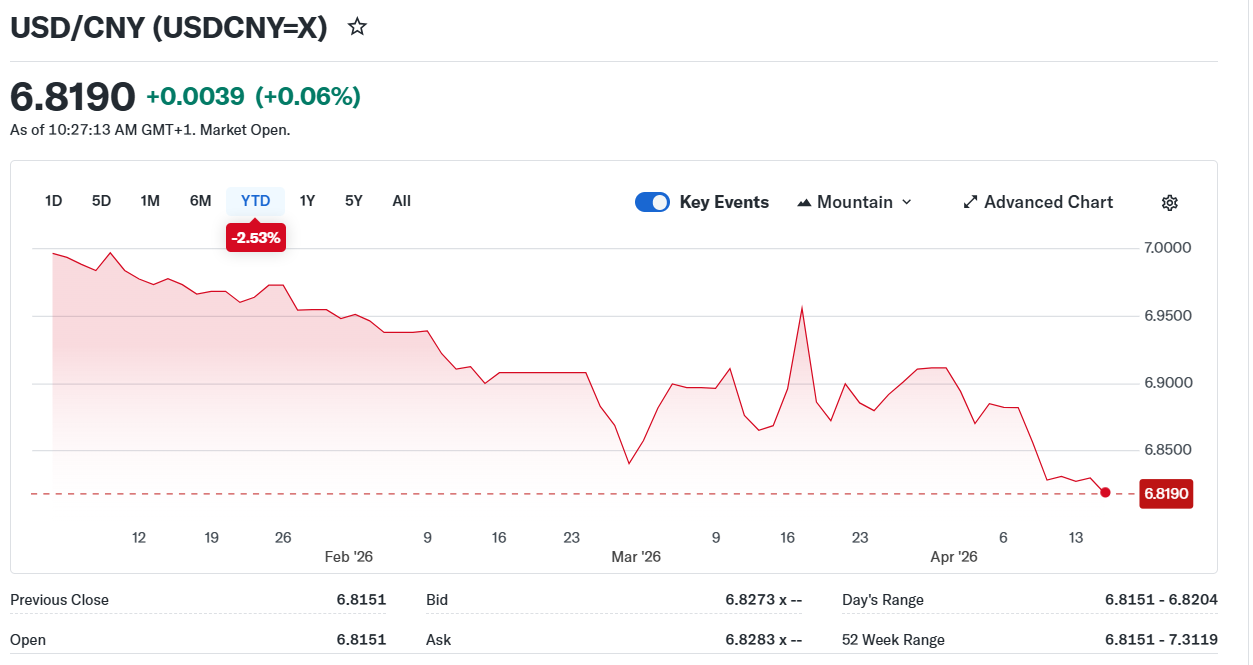
USDCNY Fix: 6.8582 vs exp. 6.8096 (Prev. 6.8593)
Shanghai Shenzhen CSI 300 fell 0.34% to 4,685.25
Sources: Investing.com, Bloomberg, Reuters, Yahoo Finance, US Census Bureau, Trading Economics Tradingview
.